OVERVIEW
Markets extended their advance last week, with gains showing up across most major asset classes. The S&P 500 rose 1.43%, while the NASDAQ led large-cap indexes with a strong 2.39% gain. The Dow Jones Industrials added 0.90%, and the S&P 100 gained 1.62%. Growth-oriented areas continue to lead the market in 2026, with the NASDAQ now up 16.05% year to date. However, leadership has broadened beyond technology, as small caps, value stocks, and emerging markets have also posted impressive gains this year.
KEY CONSIDERATIONS
When Optimism Gets Expensive – Here’s an eye-opening stat: over the past 13 months, the S&P 500 has gained more than 51%.
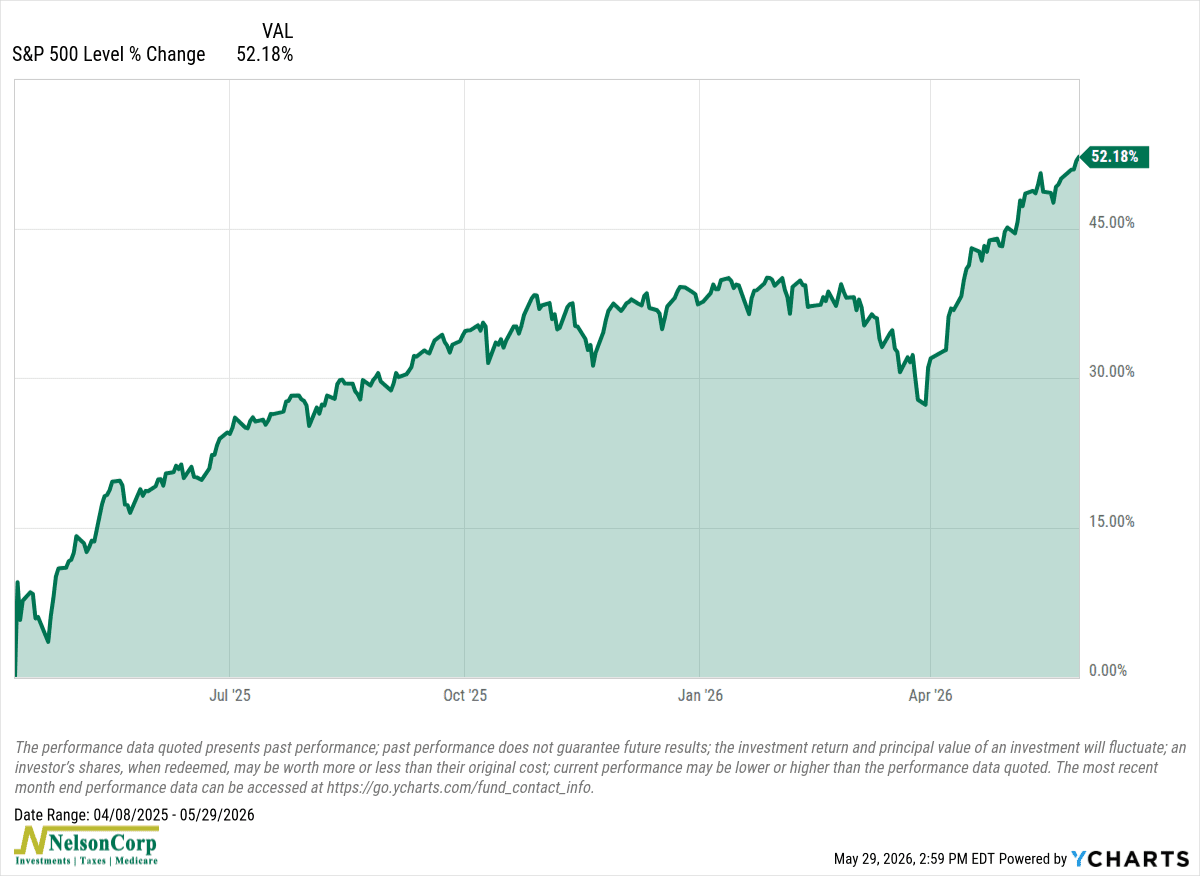
That’s a pretty strong move, but it comes with some consequences. For one, it reduces the earnings yield of stocks, which is essentially what you are “earning” from owning stocks.
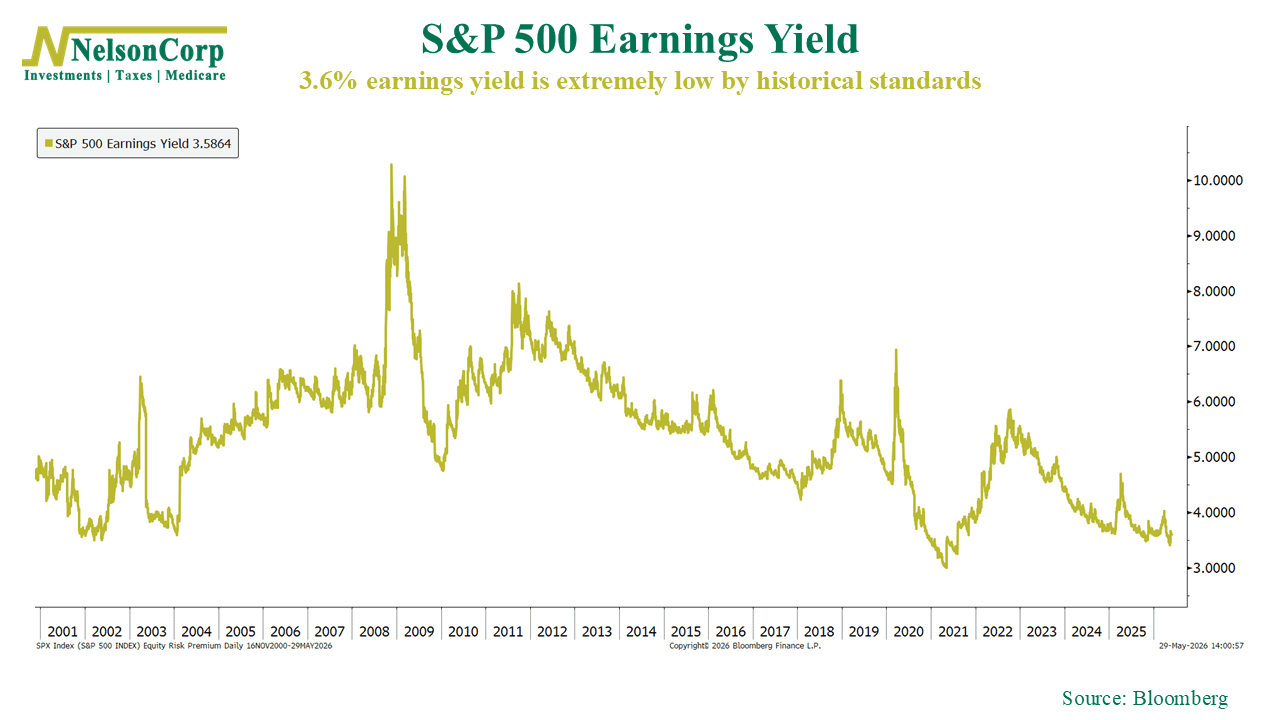
It works like this. Let’s say the stock market, in aggregate, is trading at a price of $100 per share. And let’s say the underlying earnings generated by the companies comprising the stock market are $5 per share. A little basic math tells us that equates to an earnings yield of 5% (just divide $5 by $100).
Now, those are hypothetical numbers. In reality, the S&P 500’s earnings yield is about 3.6%. That’s not very high. In fact, it’s extremely low relative to history.
But here’s where it gets even more concerning. Bonds are yielding even more than that. Yes, those boring, safe investments known as U.S. Treasuries. At the time of this writing, the 10-year Treasury was yielding about 4.4%.
Take the S&P 500’s earnings yield (3.6%) and subtract the yield on U.S. Treasuries (4.4%), and you get -0.8%. That’s what we call the “equity risk premium,” because it measures how much extra return stocks are offering compared to bonds to compensate investors for the added risk.
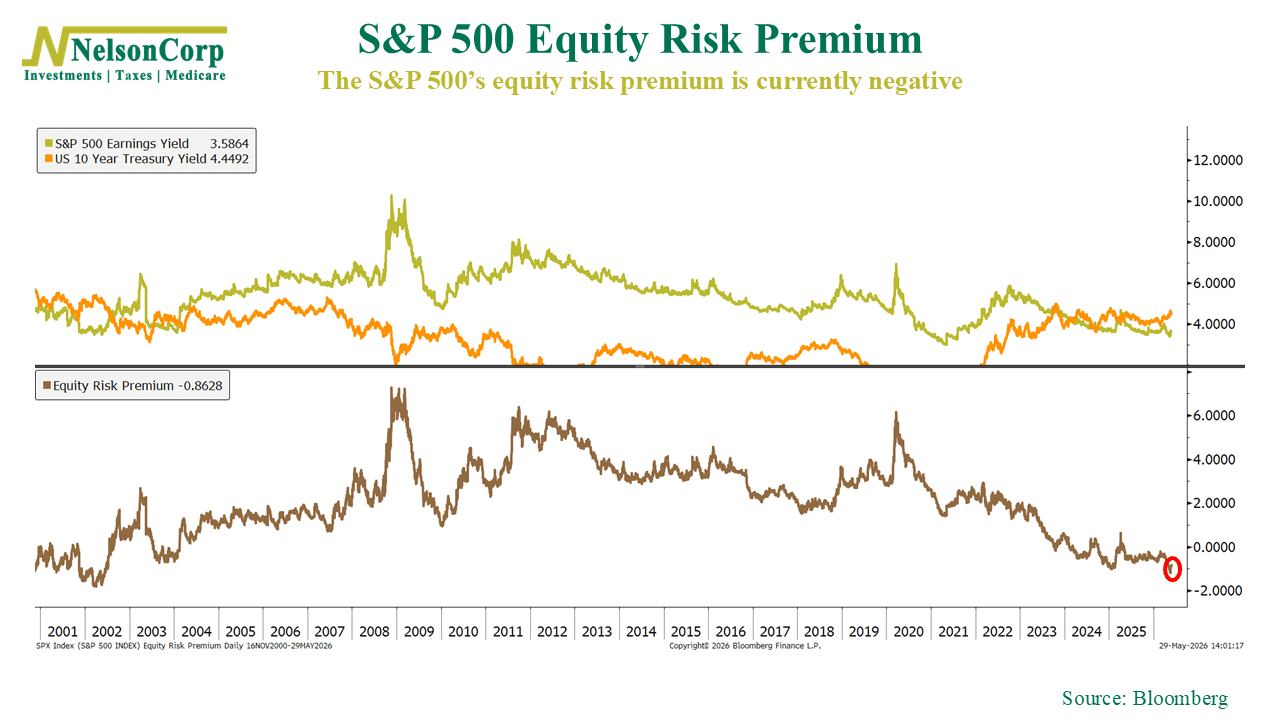
So why is that concerning? Well, because it’s a negative number. That means stocks are NOT offering an extra yield for owning them versus simply owning bonds.
Ok, ok, but that just means investors are super pumped about stocks right now, right? Is that bad?
Yes and no. Some optimism is good, sure. But too much optimism, when taken too far, can become a problem.
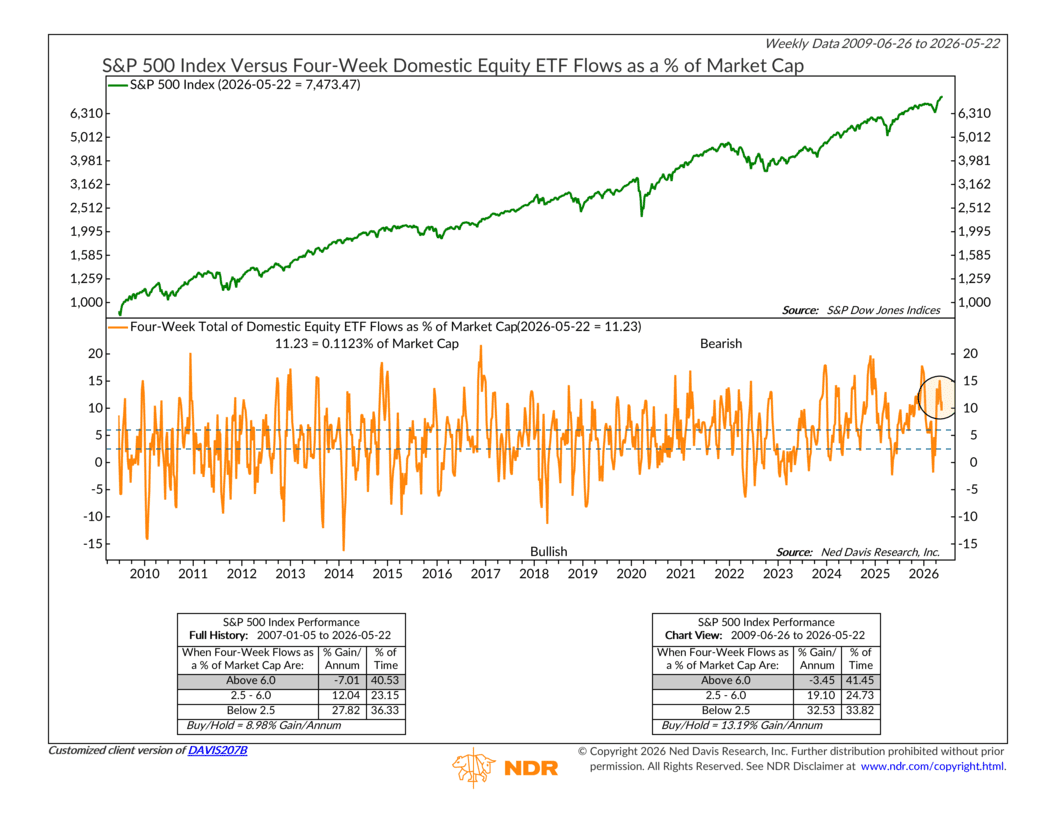
For example, the 4-week total domestic equity ETF flows have been scorching hot in recent weeks. Historically, as the indicator below shows, this hasn’t been all that great for subsequent stock returns.
But the thing is, investing is the intersection of psychology, economics, and price behavior. There’s a constant back-and-forth at play, with each influencing the market in its own way.
So even though optimism is stretched (the psychology), the actual price action is just too bullish to ignore right now. As this next indicator shows, globally, stocks took off back in the first week of April and haven’t looked back since.
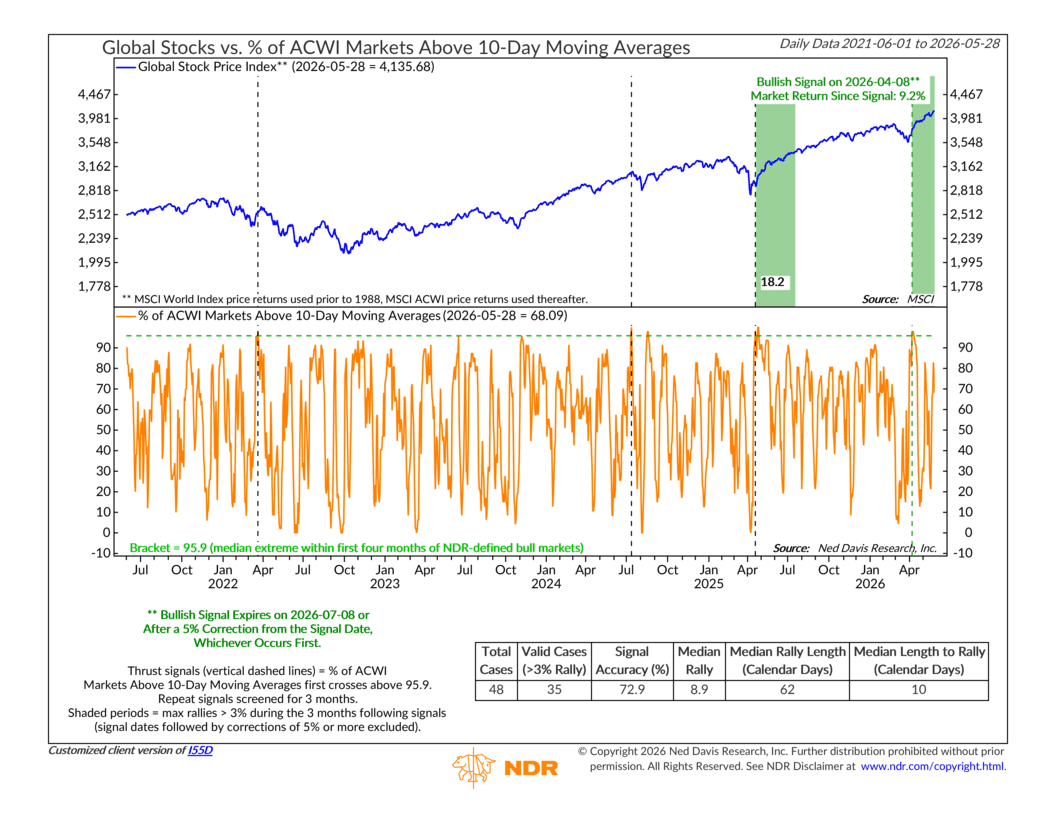
This “global thrust” will continue to influence our model in a positive way for another 5 weeks or so—unless we get a correction of 5% or more in the meantime.
Taken together, the message is mixed. Valuations are rich, optimism is elevated, and the equity risk premium is flashing caution. Yet momentum remains firmly in the bulls’ favor. For now, the market appears willing to look past the risks, but the higher stocks climb, the less room there is for disappointment.
This is intended for informational purposes only and should not be used as the primary basis for an investment decision. Consult an advisor for your personal situation.
Indices mentioned are unmanaged, do not incur fees, and cannot be invested into directly.
Past performance does not guarantee future results.
The S&P 500 Index, or Standard & Poor’s 500 Index, is a market-capitalization-weighted index of 500 leading publicly traded companies in the U.S.
The Dow Jones Industrial Average (DJIA) is a price-weighted index composed of 30 widely traded blue-chip U.S. common stocks. The Nasdaq 100 Index is a basket of the 100 largest, most actively traded U.S. companies listed on the Nasdaq stock exchange. The index includes companies from various industries except for the financial industry, like commercial and investment banks. The Russell 3000 Index is a capitalization-weighted stock market index that seeks to be a benchmark of the entire U.S. stock market. The S&P MidCap 400 is designed to measure the performance of 400 mid-sized companies, reflecting the distinctive risk and return characteristics of this market segment. S&P 600 Index measures the small-cap segment of the U.S. equity market. The index is designed to track companies that meet specific inclusion criteria to ensure that they are liquid and financially viable. The S&P 100 index is a capitalization-weighted index based on 100 highly capitalized stocks for which options are listed on the CBOE (Chicago Board of Exchange). The MSCI EAFE Index is an equity index which captures large and mid cap representation across 21 Developed Markets countries* around the world, excluding the US and Canada.
The Bloomberg U.S. Corporate Bond Index measures the investment grade, fixed-rate, taxable corporate bond market. The Bloomberg U.S. Corporate High Yield Index is comprised of domestic and corporate bonds rated Ba and below with a minimum outstanding amount of $150 million. The Bloomberg U.S. Municipal Index covers the USD-denominated long-term tax exempt bond market. The index has four main sectors: state and local general obligation bonds, revenue bonds, insured bonds and prerefunded bonds.