
OVERVIEW
KEY CONSIDERATIONS
Who Blinks First – Let me describe two markets to you.
In the first one, the S&P 500 just closed at a record high, earnings are growing close to 30%, and the economy has held up. In the second one, fewer than a third of the stocks in the index are above their 50-day average, consumer confidence just hit a 12-year low, and a growing number of the long-term indicators we follow lean bearish.
Here’s the thing. They’re the same market.
Start with the first chart below. The S&P 500 closed at a record on Tuesday, its first since August 13. The bottom panel shows how many of its 500 stocks were trading above their own 50-day moving average, which is a simple way of asking how many are still in an uptrend. At the August record, 69% of them were. At Tuesday’s record, 29% were.
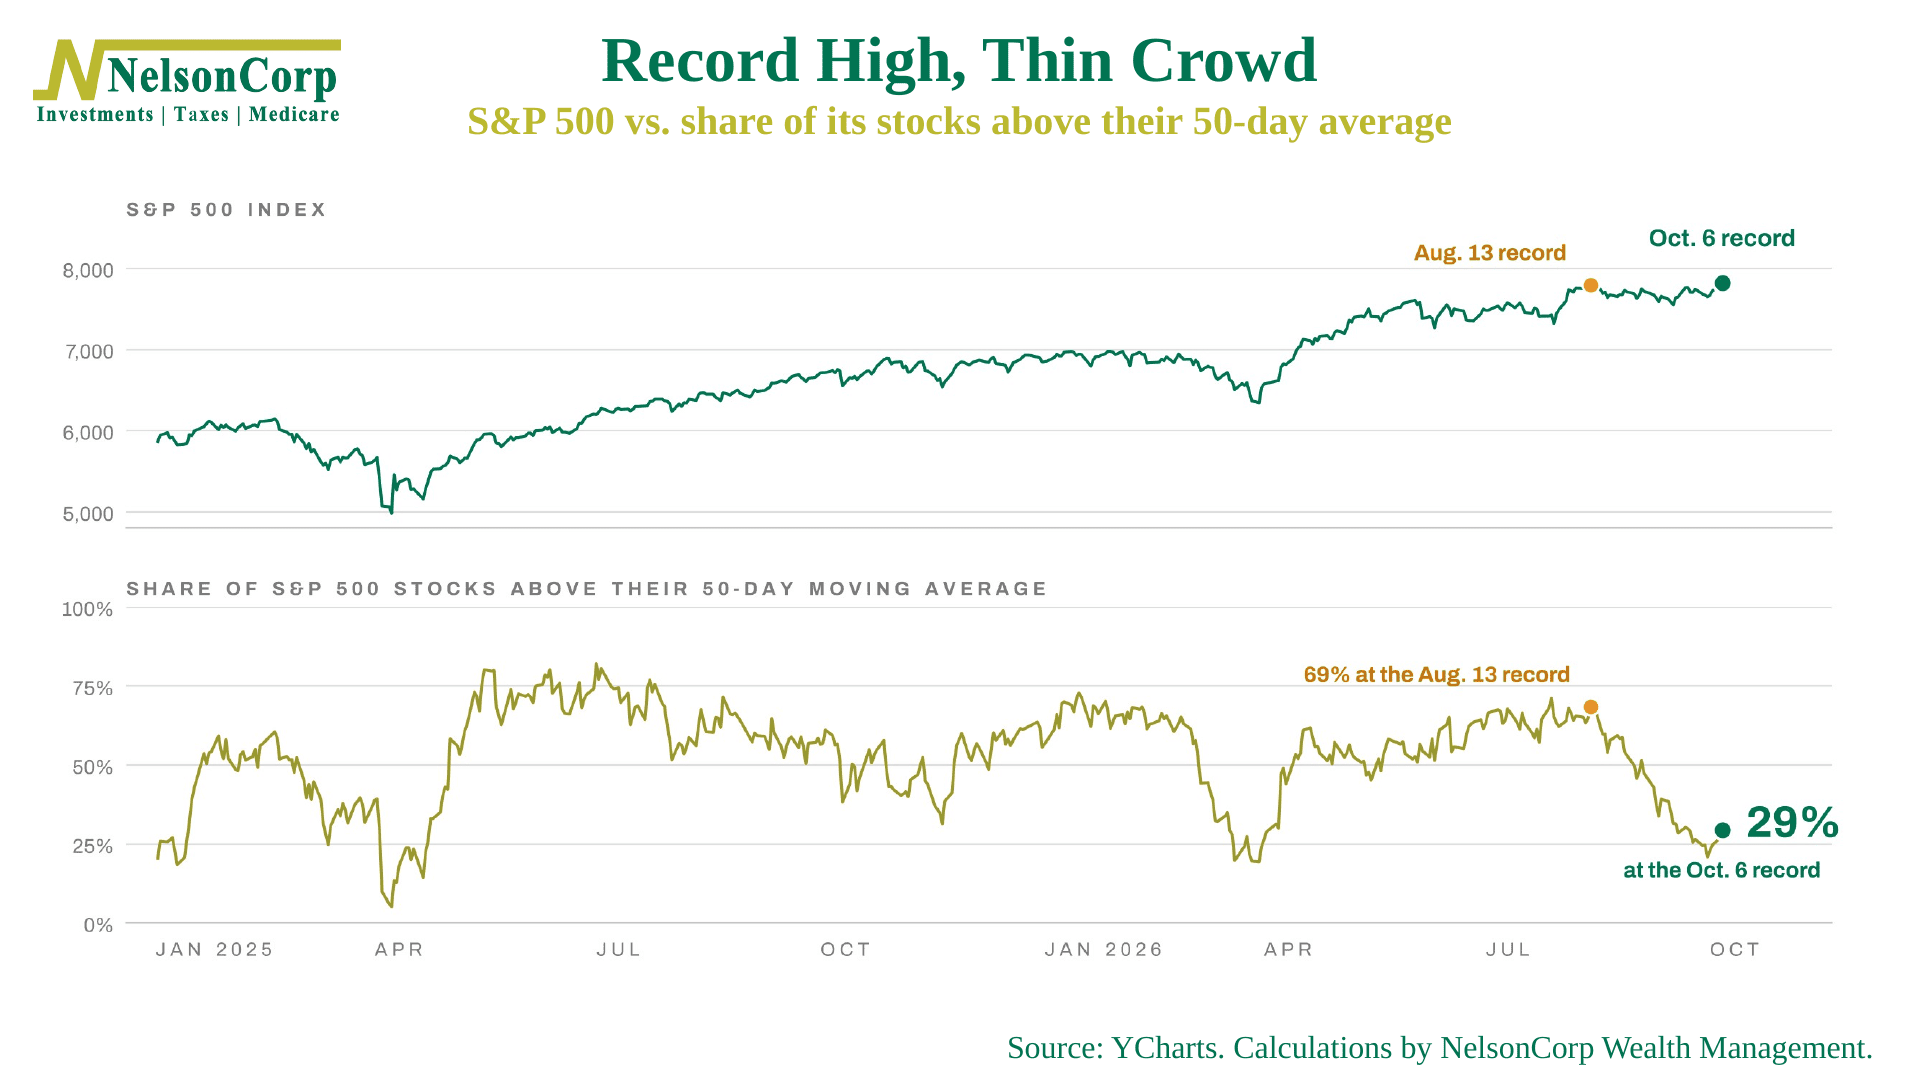
That is a very different kind of record high. By our count, more than a third of the stocks in the index are lower today than they were at the end of March, even though the index itself is up more than 20% since then. A handful of very large technology companies are carrying the load. Everyone else is dealing with a 10-year Treasury yield that touched 5.37% on Wednesday, oil back over $100, and a Fed whose own minutes say most officials expect another hike by year-end.
So what do the indicators make of this? The second chart is one way to answer: a broad composite that adds up more than 100 trend and breadth measures across the whole market and asks what share of them are bullish. Right now the answer is about 53%, and it’s falling. That puts it in its lowest zone, where the S&P 500 has historically lost about 8% a year, compared with a gain of about 28% a year in the top zone. It gets worse when the composite is in that zone and still falling, as it is now. In those stretches the index has lost closer to 17% a year.
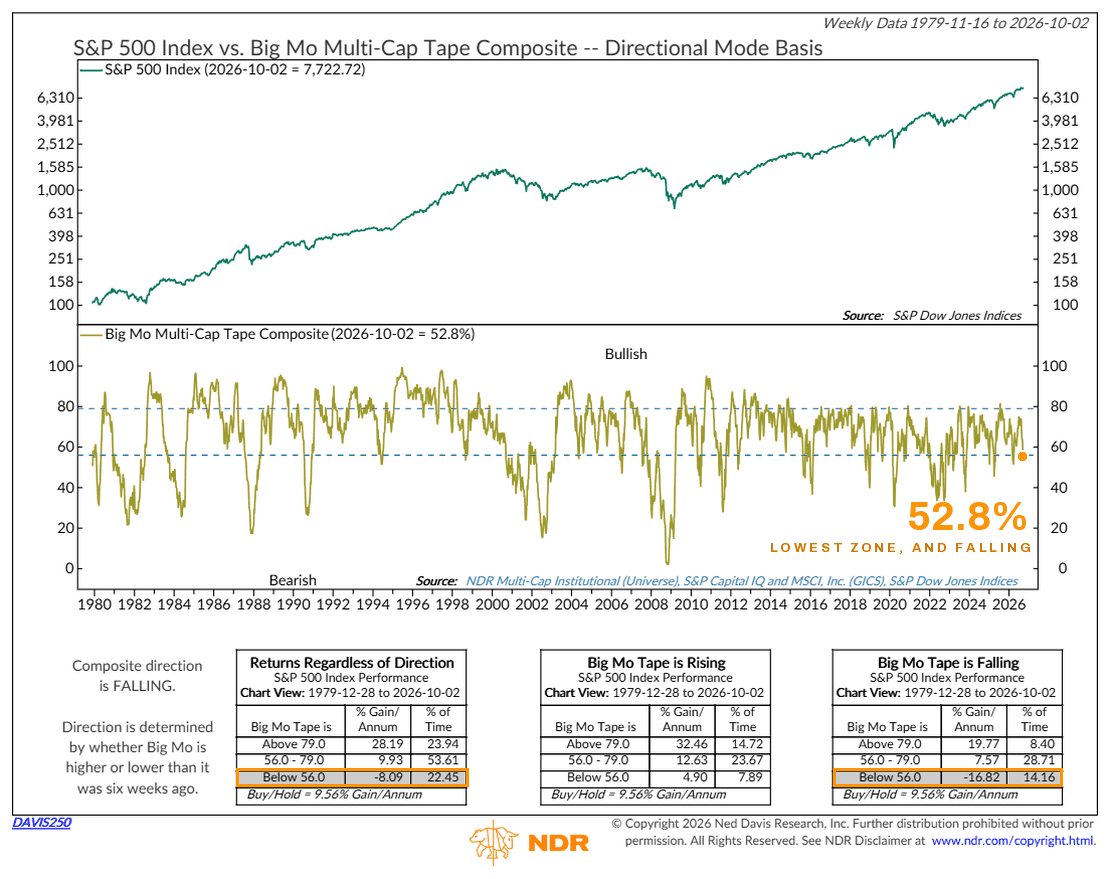
It isn’t alone. Over the past few weeks a growing share of the indicators we follow has rolled over. Participation. Volume. Interest rates. Valuation was already there.
Ok, but here’s the other side. The price hasn’t blinked. And as we discussed in this week’s Indicator Insights, the one indicator that only cares about price still says the trend is up. It won’t say otherwise until the S&P 500 closes a week more than 7.2% below its August high, which works out to about 7,225. Until then, the bull market gets the benefit of the doubt.
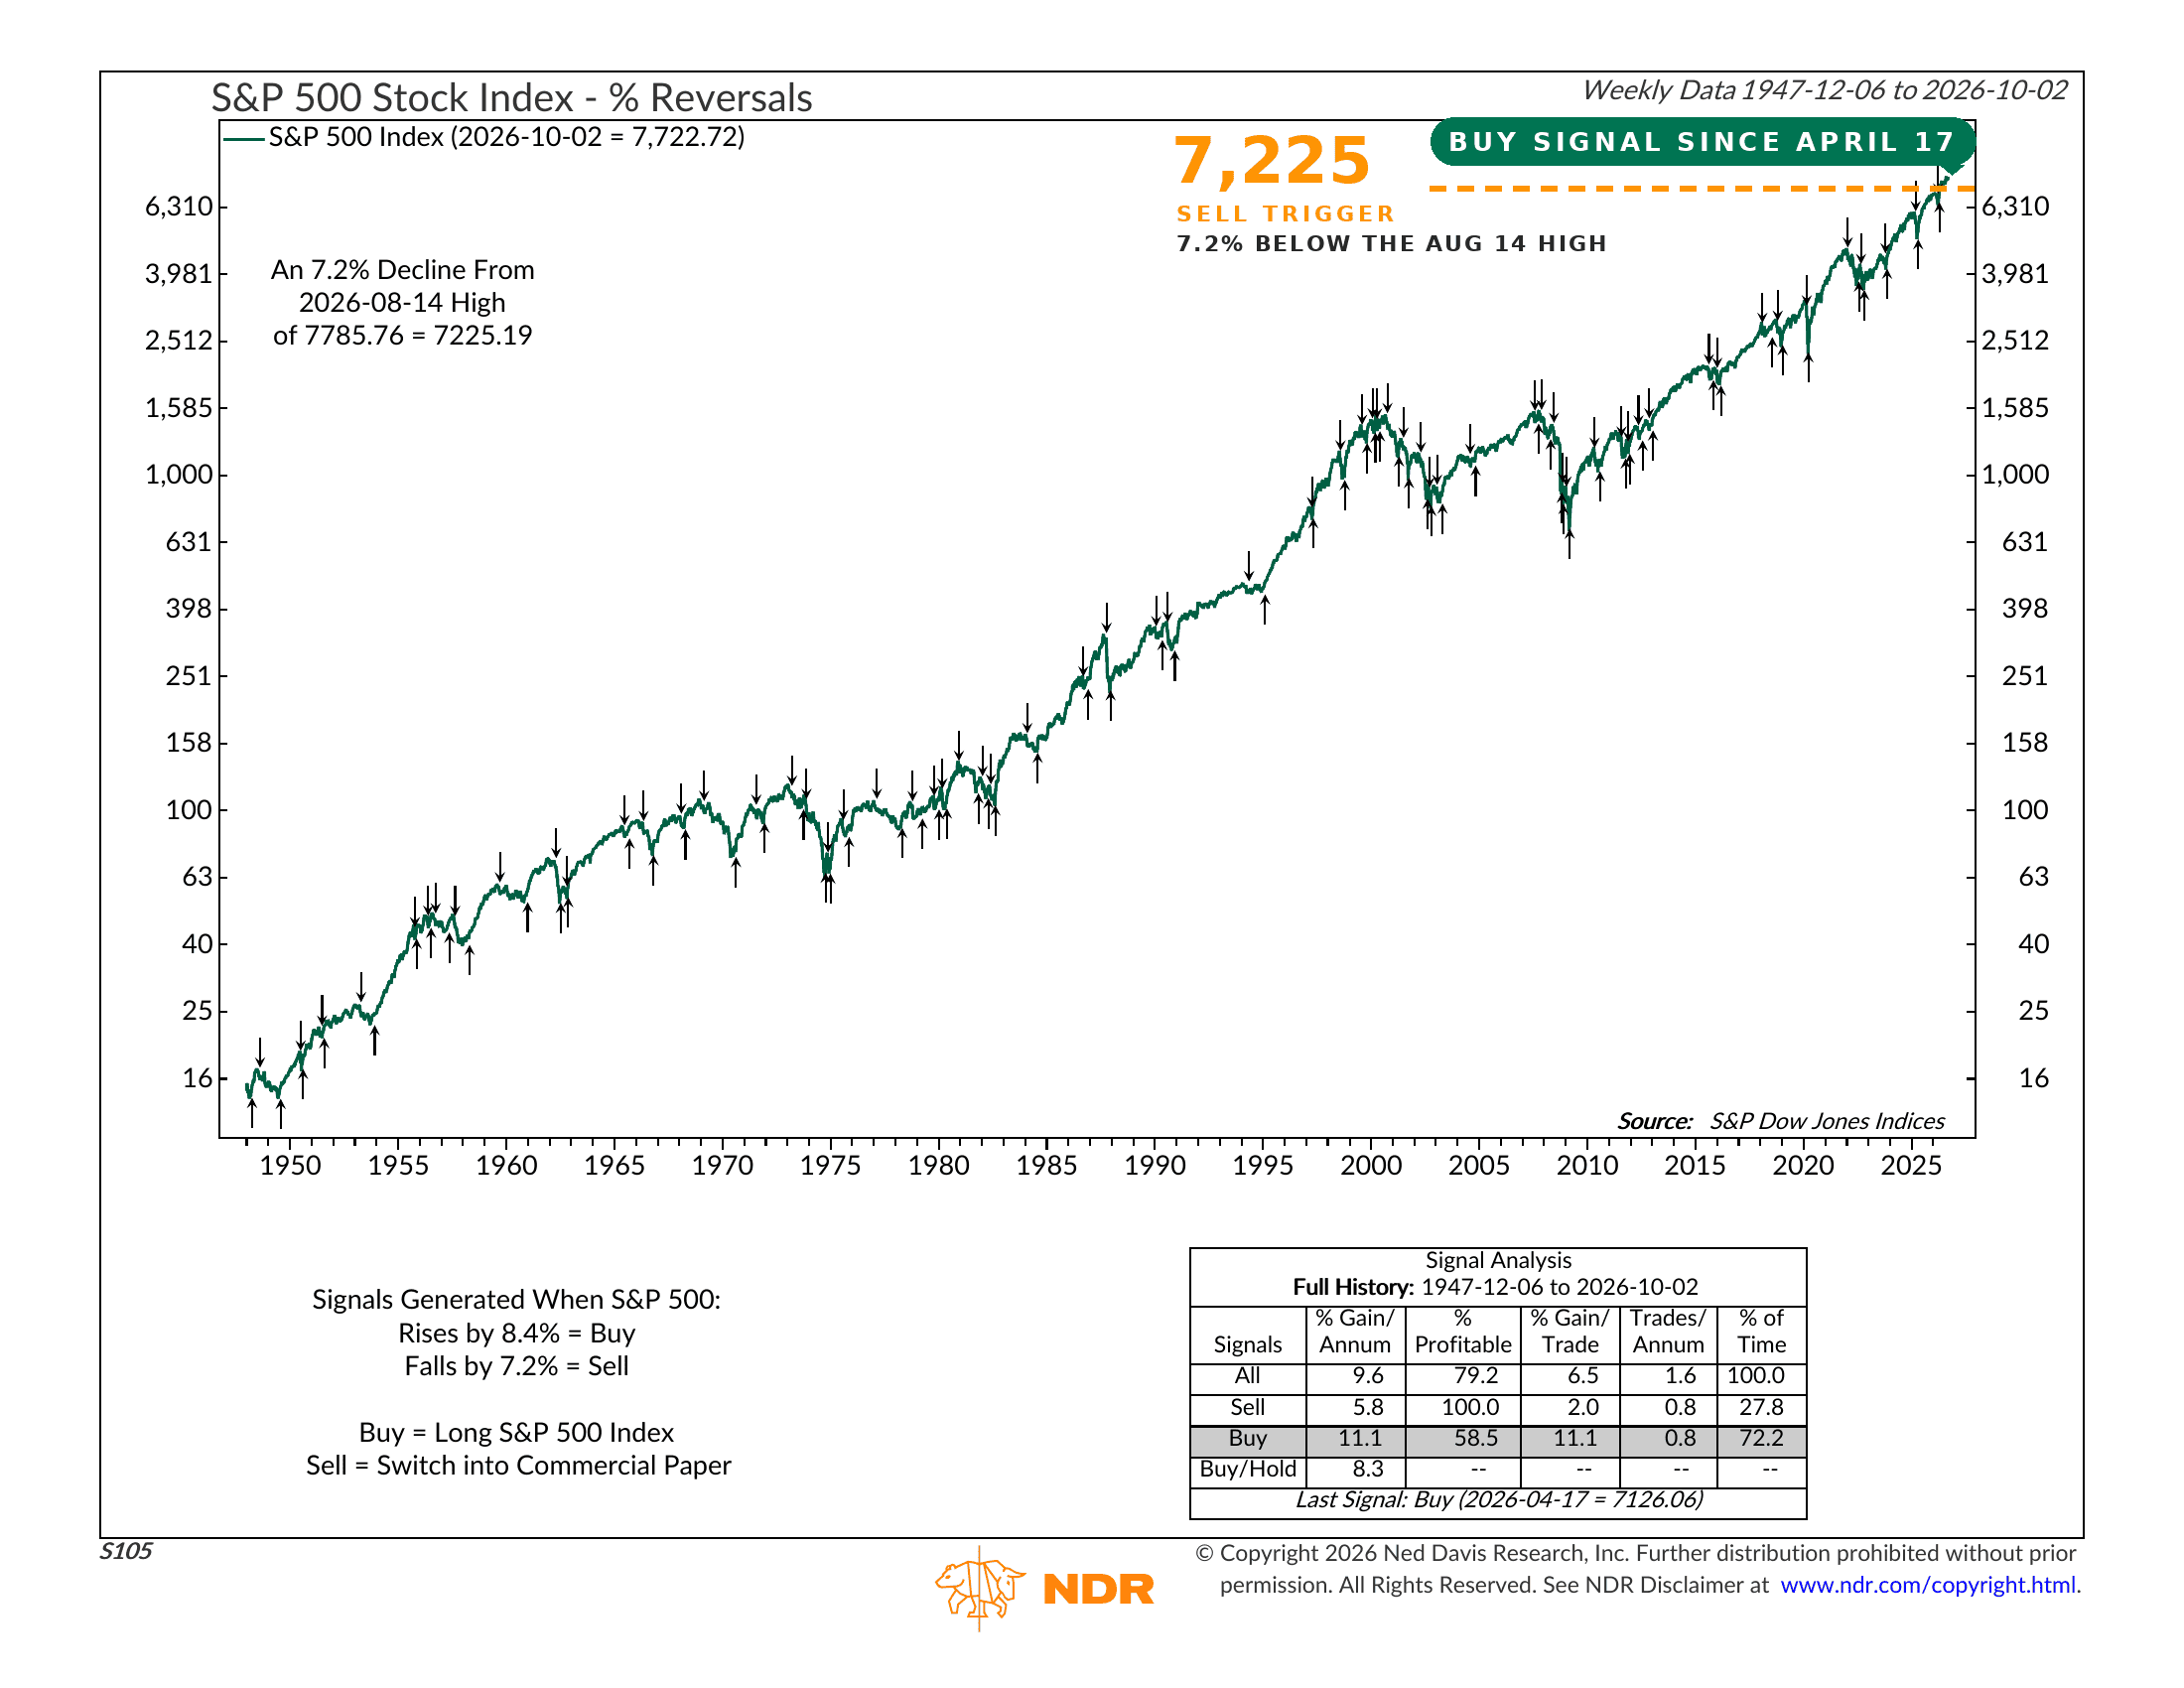
That’s the standoff. The indicators say be careful. The price says not yet.
There are two ways it resolves. The healthy way is for the crowd to fill back in, with more stocks joining the rally. The other way is for the price to finally agree with the indicators and break that line. Earnings season, which starts Tuesday with the big banks, is the most likely thing to tip it one way or the other.
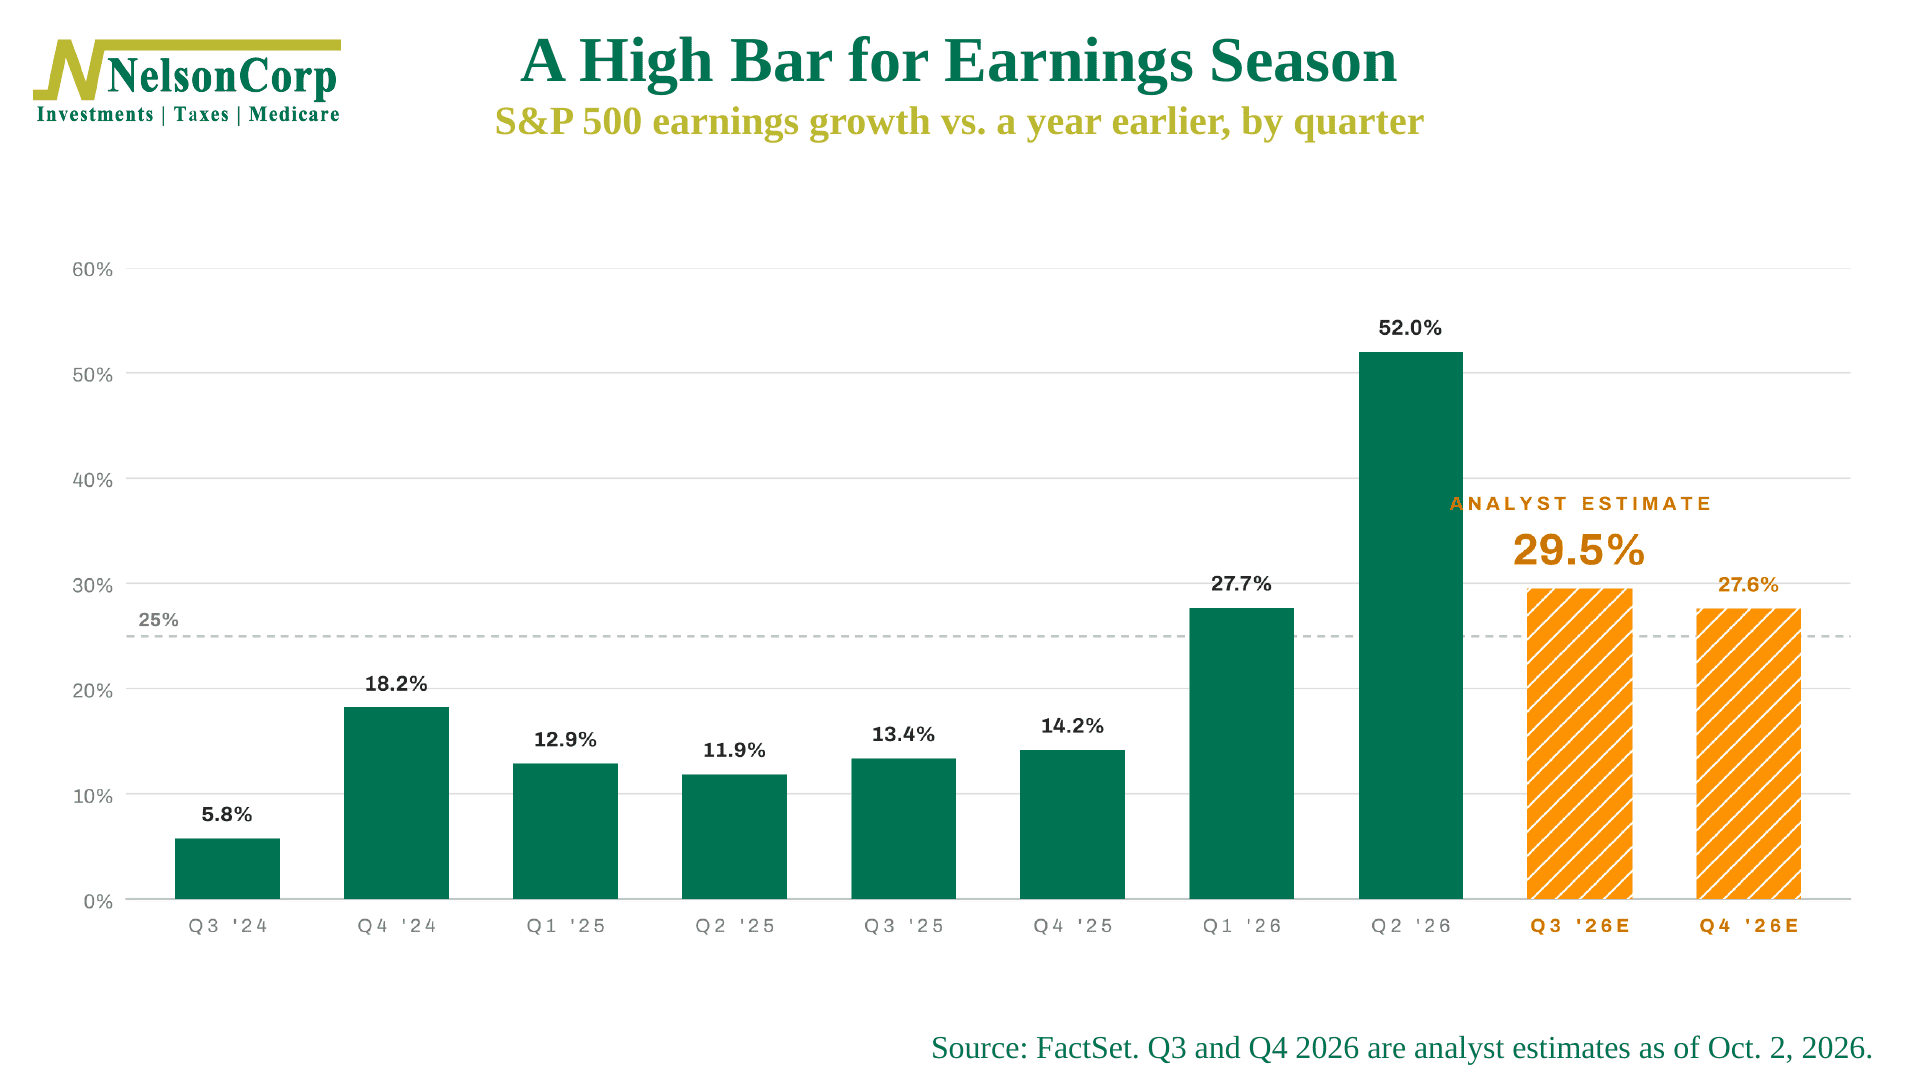
This last chart shows the bar. Analysts are looking for profits to grow 29.5% from a year ago, which would make it three quarters in a row above 25%. That is a lot to live up to. Then again, as we showed in this week’s Chart of the Week, earnings have done all of the lifting this year while the price people pay for them has come down.
The bottom line? When the indicators and the price disagree like this, the best move is usually to let them settle it. The weight of the evidence has gotten weaker. The trend has not broken. That combination calls for patience and a clear line to watch. Somebody has to blink first. What happens next in this bull market depends on who.
This is intended for informational purposes only and should not be used as the primary basis for an investment decision. Consult an advisor for your personal situation.
Indices mentioned are unmanaged, do not incur fees, and cannot be invested into directly.
Past performance does not guarantee future results.
The S&P 500 Index, or Standard & Poor’s 500 Index, is a market-capitalization-weighted index of 500 leading publicly traded companies in the U.S. The S&P 500 Equal Weight Index is a version of the S&P 500 in which each of the 500 companies is given the same weight, so it reflects the performance of the average stock in the index rather than the largest companies.
The Dow Jones Industrial Average (DJIA) is a price-weighted index composed of 30 widely traded blue-chip U.S. common stocks. The Nasdaq 100 Index is a basket of the 100 largest, most actively traded U.S. companies listed on the Nasdaq stock exchange. The index includes companies from various industries except for the financial industry, like commercial and investment banks. The Russell 3000 Index is a capitalization-weighted stock market index that seeks to be a benchmark of the entire U.S. stock market. The S&P MidCap 400 is designed to measure the performance of 400 mid-sized companies, reflecting the distinctive risk and return characteristics of this market segment. S&P 600 Index measures the small-cap segment of the U.S. equity market. The index is designed to track companies that meet specific inclusion criteria to ensure that they are liquid and financially viable. The S&P 100 index is a capitalization-weighted index based on 100 highly capitalized stocks for which options are listed on the CBOE (Chicago Board of Exchange). The MSCI EAFE Index is an equity index which captures large and mid cap representation across 21 Developed Markets countries* around the world, excluding the US and Canada.
The Bloomberg U.S. Corporate Bond Index measures the investment grade, fixed-rate, taxable corporate bond market. The Bloomberg U.S. Corporate High Yield Index is comprised of domestic and corporate bonds rated Ba and below with a minimum outstanding amount of $150 million. The Bloomberg U.S. Municipal Index covers the USD-denominated long-term tax exempt bond market. The index has four main sectors: state and local general obligation bonds, revenue bonds, insured bonds and prerefunded bonds.