OVERVIEW
Markets pulled back last week as technology stocks led declines and volatility spiked. The S&P 500 fell 1.63%, the Dow Jones Industrial Average dropped 1.21%, and the NASDAQ sank 3.04%, giving back a portion of recent gains. Broadly, the Russell 3000 lost 1.60%, as growth stocks slid 2.88% and value held nearly flat at -0.06%.
Small and mid-sized companies were mixed—mid-caps (S&P 400) edged down 0.10%, while small-caps (S&P 600) managed a modest 0.16% gain. International markets were weaker overall, with developed markets (EAFE) off 0.81%, and emerging markets slipping 1.42%, despite continued leadership from Asia earlier in the year.
Bonds were mostly lower as yields inched higher again. Long-term Treasuries fell 0.45%, investment-grade bonds eased 0.19%, and high-yield issues dropped 0.29%. Short- and intermediate-term Treasuries posted slight gains, up 0.09% and 0.06%, respectively.
Commodities and alternatives showed mixed performance. Oil declined 1.79%, while gold rose 0.50%, adding to an already strong 52% year-to-date gain. Real estate and MLPs both climbed, up 1.18% and 1.24%, respectively, while the U.S. dollar slipped 0.18%. The VIX spiked 9.40%, reflecting a rise in investor caution after several weeks of relative calm.
KEY CONSIDERATIONS
Wobbly Wall Street – It was a shaky week on Wall Street. After such a long stretch of strength, even small disruptions can start to show cracks—and several of the indicators we track are beginning to roll over.
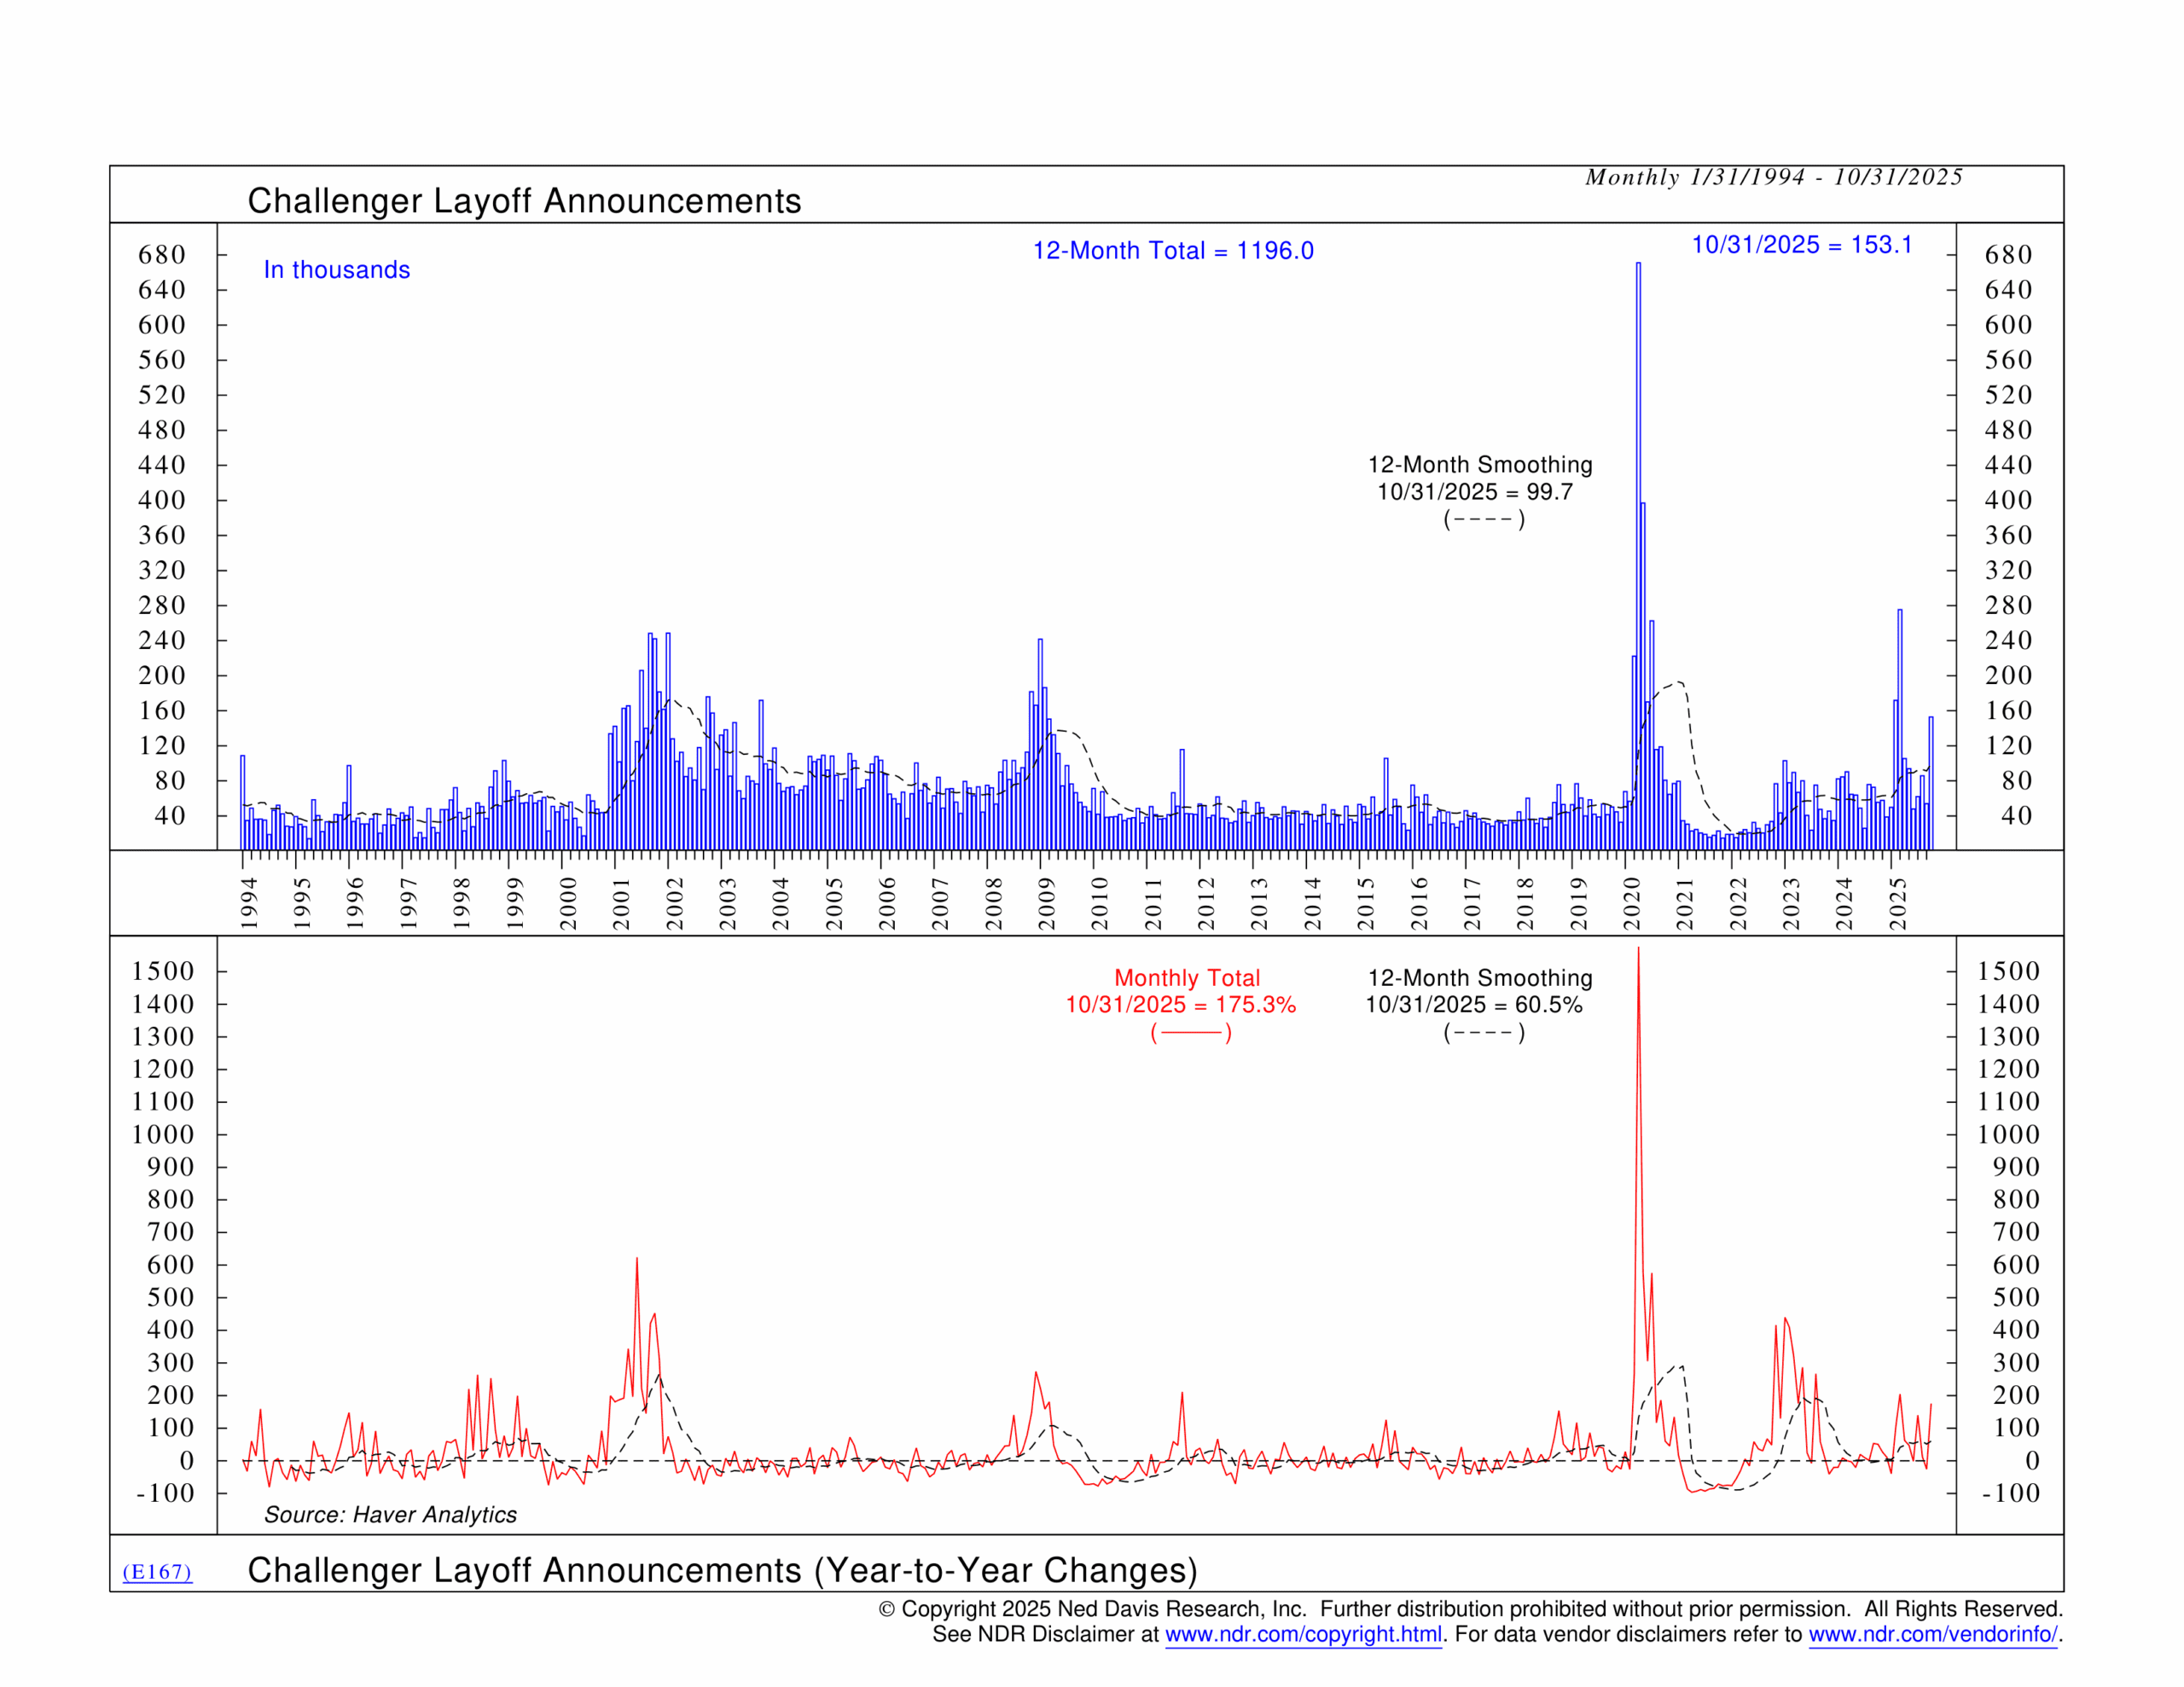
For example, one of the biggest stories last week was the spike in layoff announcements. According to the outplacement firm Challenger, Gray & Christmas, job cuts surged to 153,074 in October—a 183% jump from September and 175% higher than a year ago. That’s the highest level for any October since 2003 and makes this the worst year for announced layoffs since 2009.
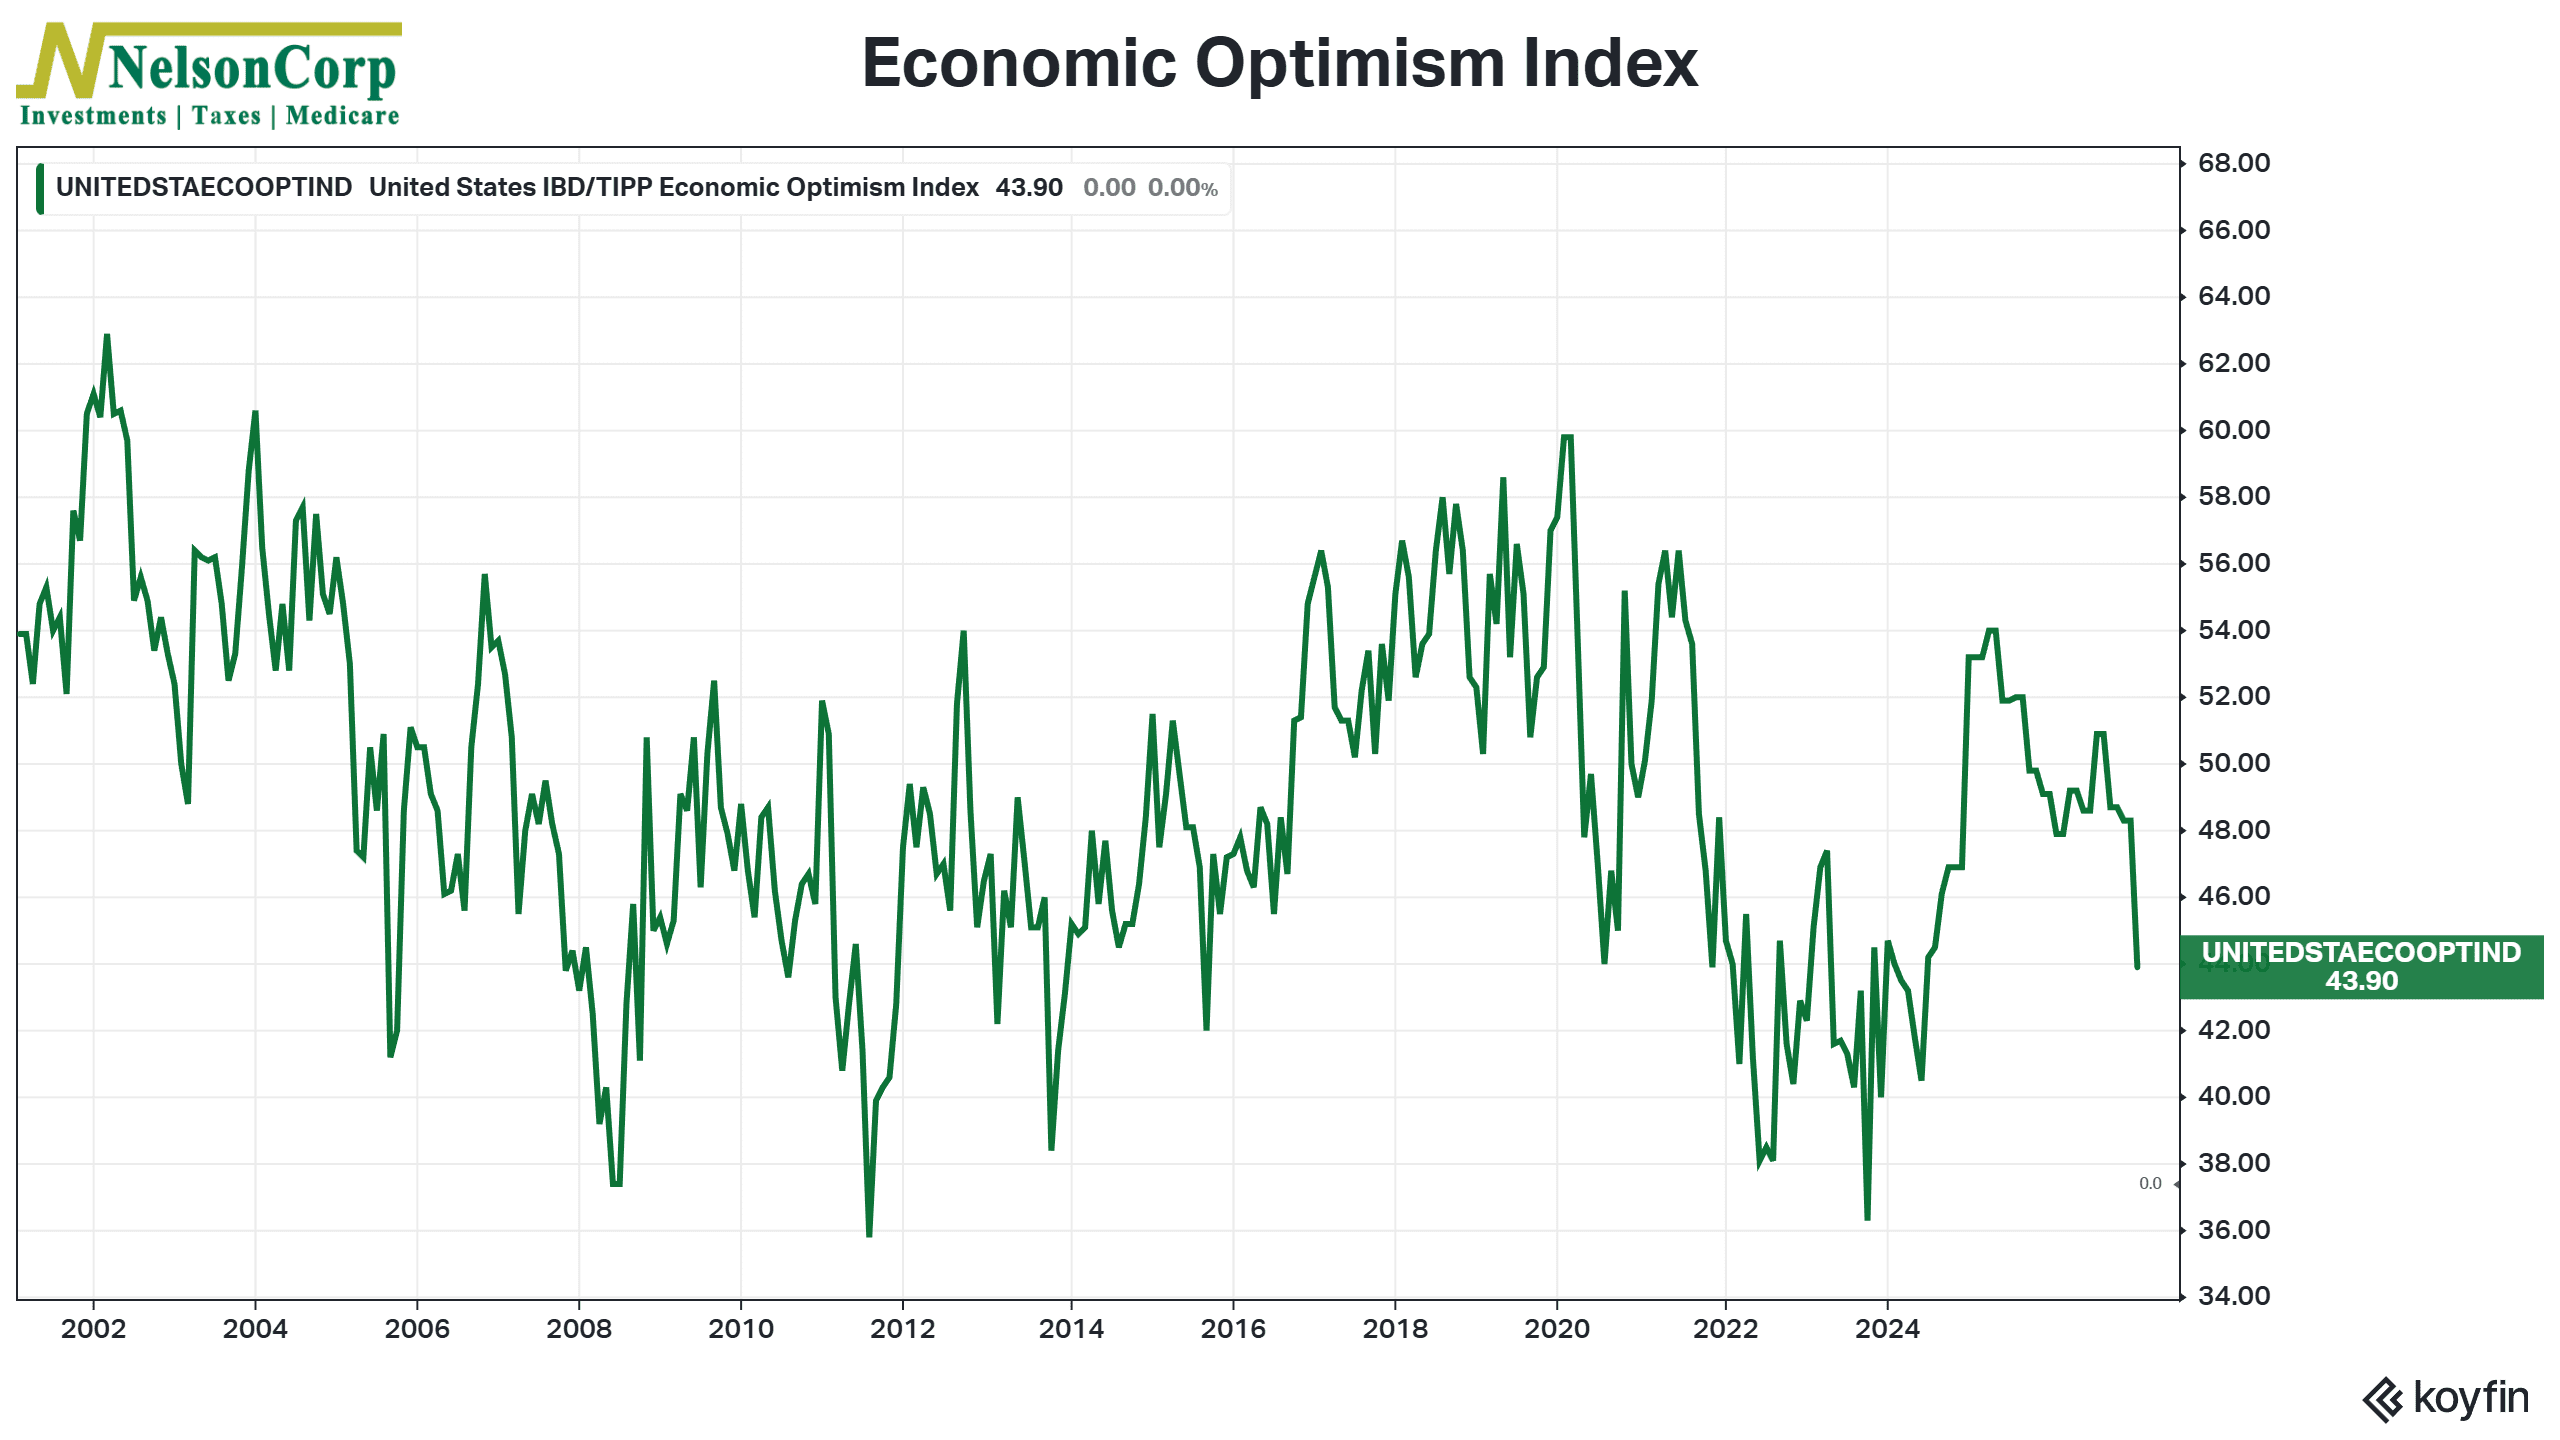
We already knew the labor market was softening, so this shouldn’t have come as too much of a surprise. But as this week’s Chart of the Week highlighted, it’s happening alongside a sharp drop in sentiment toward the economy. Not only has overall economic optimism fallen (shown below), but Friday’s preliminary survey results from the University of Michigan showed consumer sentiment sliding toward record-low levels.
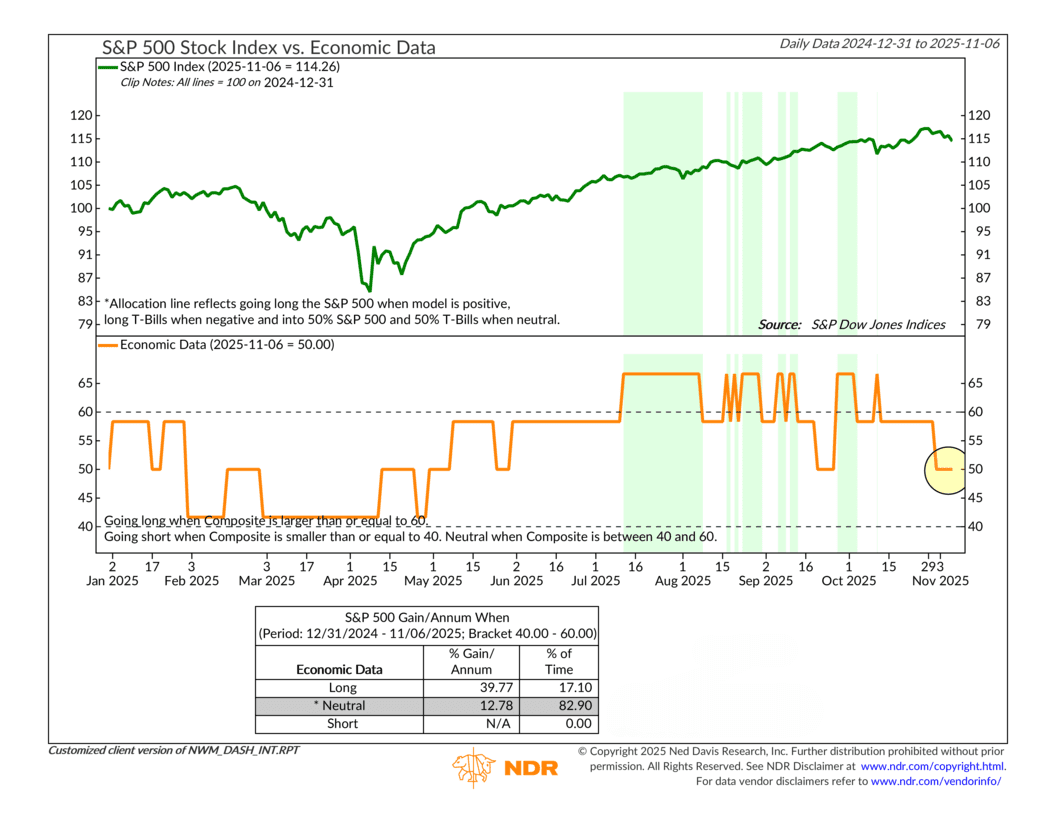
In other words, all this is to say that the economic environment has weakened quite a bit over the past, let’s say, month or so. As you can see from our Economic Data Composite, shown below, the weight of the indicator evidence has dipped to Neutral (a reading of 50%) after several months of positive momentum through summer and early fall.
What does this mean for our overall model? Well, since the Investor Behavior component remains pretty weak—mostly due to elevated valuations levels—it means that market’s Price Movement is going to determine where we go next. Last week, I showed that the indicator evidence still leaned bullish, but as we’ve seen before, things can change quickly.
There is a bit of a dichotomy going on here. Although the market’s trend remains strong and momentum remains semi-strong, the rest of the model has deteriorated into Neutral territory. In the past few weeks, we’ve seen participation weaken, trading volume and inflows thin, and the market’s relative strength has faded.
Here’s one example of what I’m talking about. The following chart compares the 150-day rate-of-change of the S&P 500 Index to the 150-day rate-of-change of the S&P 500 Financial sector. You can think of the financial sector as a leading indicator for the overall market, so when it weakens relative to the rest of the market, it tends to be a warning sign.

As you can see from that line on the bottom clip of the chart, the financial sector has been slowly diverging from the market all year, and finally last week it dipped into negative territory, a sign that the market’s relative strength has weakened quite a bit.
Okay, so what does this all mean? Well, basically, all signs point to a market this is starting to pullback after a rip-roaring run. Does that mean the market is headed for a crash, a correction, or merely a brief pullback? It’s too early to tell. But the underlying environment, according to our indicators, suggests risks are building beneath the surface.
This is intended for informational purposes only and should not be used as the primary basis for an investment decision. Consult an advisor for your personal situation.
Indices mentioned are unmanaged, do not incur fees, and cannot be invested into directly.
Past performance does not guarantee future results.
The S&P 500 Index, or Standard & Poor’s 500 Index, is a market-capitalization-weighted index of 500 leading publicly traded companies in the U.S.
The Dow Jones Industrial Average (DJIA) is a price-weighted index composed of 30 widely traded blue-chip U.S. common stocks. The Nasdaq 100 Index is a basket of the 100 largest, most actively traded U.S. companies listed on the Nasdaq stock exchange. The index includes companies from various industries except for the financial industry, like commercial and investment banks. The Russell 3000 Index is a capitalization-weighted stock market index that seeks to be a benchmark of the entire U.S. stock market. The S&P MidCap 400 is designed to measure the performance of 400 mid-sized companies, reflecting the distinctive risk and return characteristics of this market segment. S&P 600 Index measures the small-cap segment of the U.S. equity market. The index is designed to track companies that meet specific inclusion criteria to ensure that they are liquid and financially viable. The S&P 100 index is a capitalization-weighted index based on 100 highly capitalized stocks for which options are listed on the CBOE (Chicago Board of Exchange). The MSCI EAFE Index is an equity index which captures large and mid cap representation across 21 Developed Markets countries* around the world, excluding the US and Canada.
The Bloomberg U.S. Corporate Bond Index measures the investment grade, fixed-rate, taxable corporate bond market. The Bloomberg U.S. Corporate High Yield Index is comprised of domestic and corporate bonds rated Ba and below with a minimum outstanding amount of $150 million. The Bloomberg U.S. Municipal Index covers the USD-denominated long-term tax exempt bond market. The index has four main sectors: state and local general obligation bonds, revenue bonds, insured bonds and prerefunded bonds.