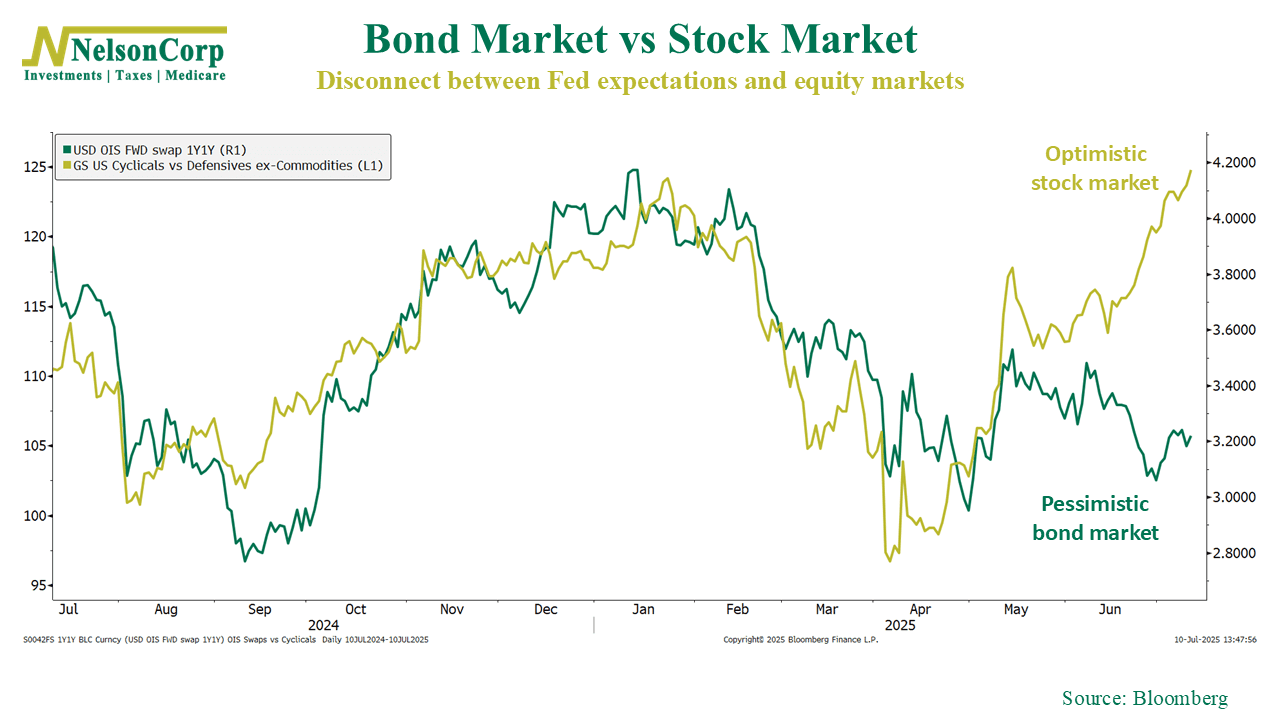
This week’s chart highlights a growing gap between what the bond market expects and how the stock market is behaving. The green line shows the USD 1y1y OIS swap rate, which is a measure of where investors think short-term interest rates will be between one and two years from now. This has been drifting lower, suggesting the bond market is leaning toward Fed rate cuts, mainly due to concerns about slowing growth or cooling inflation.
But the gold line, which tracks how cyclical stocks are performing relative to defensives, tells a very different story. It’s been surging higher, meaning equity investors are favoring the kinds of companies that tend to do well in a strong economy, things like industrials, consumer goods, and financials. In short, stocks are pricing in strength, while bonds are bracing for softness.
These mixed signals don’t typically coexist for long. Either the bond market is too pessimistic, or the stock market is too optimistic. History says they can’t both be right.
The takeaway? The bond market is flashing caution, while stocks are signaling confidence. When markets send conflicting messages, staying grounded and disciplined is as important as ever.
This is intended for informational purposes only and should not be used as the primary basis for an investment decision. Consult an advisor for your personal situation.
Indices mentioned are unmanaged, do not incur fees, and cannot be invested into directly.
Past performance does not guarantee future results.
The S&P 500 Index, or Standard & Poor’s 500 Index, is a market-capitalization-weighted index of 500 leading publicly traded companies in the U.S.