This week’s indicator is all about the long-term slope—or trend—of the stock market. It uses two moving averages to measure the direction and strength of that slope. The concept is pretty straightforward: when the slope is steep, the market is trending higher; when it flattens out, the trend is weakening or reversing.
Trend-following strategies like this one aren’t trying to call the top or bottom. Instead, they aim to capture the middle of the move—what you might call the “meat”—while sidestepping the worst of deep drawdowns. In short, it’s a trend tool with risk management built in.
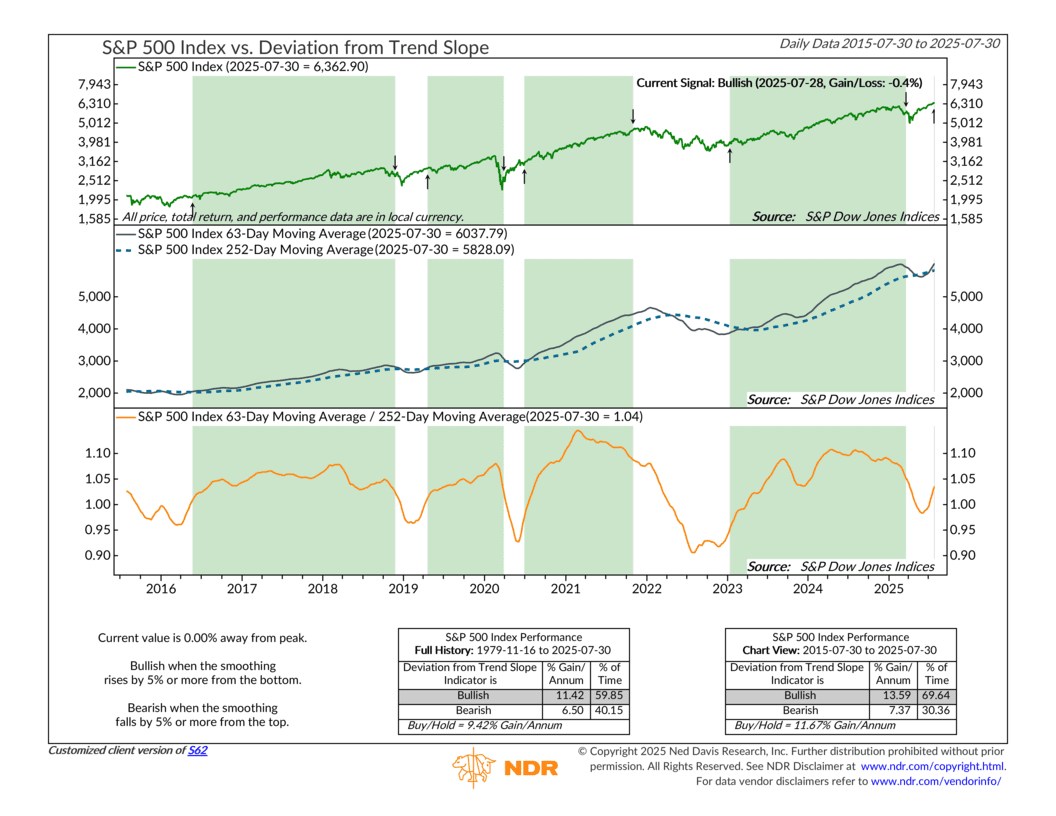
Here’s how it works: the indicator compares the short-term (63-day) moving average of the S&P 500 to its longer-term (252-day) moving average. A bullish signal is triggered when the ratio between these two rises 5% or more from its prior bottom. A bearish signal kicks in when the ratio falls 5% or more from its most recent top.
Historically, this tool has given investors a solid edge. Since 1979, the S&P 500 has returned 11.42% annually when the indicator is bullish—much stronger than the 6.50% return during bearish periods. And unlike some other indicators, the results have held up recently, too. From 2015 to 2025, annual returns during bullish periods climbed to 13.59%, compared to 7.37% when bearish.
As of July 30, the indicator shows a ratio of 1.04—meaning the 63-day average is 4% above the 252-day average. That’s consistent with a bullish signal, which remains in place after the April tariff-driven sell-off briefly shook the trend. In other words, the market is healing!
The bottom line? This tool can serve as a simple trend confirmation overlay—helping you lean into risk when conditions are favorable and take a more cautious stance when the trend weakens. When paired with other indicators like market breadth or macro signals, it can be a powerful addition to a portfolio strategy.
This is intended for informational purposes only and should not be used as the primary basis for an investment decision. Consult an advisor for your personal situation.
Indices mentioned are unmanaged, do not incur fees, and cannot be invested into directly.
Past performance does not guarantee future results.
The S&P 500 Index, or Standard & Poor’s 500 Index, is a market-capitalization-weighted index of 500 leading publicly traded companies in the U.S