by NelsonCorp | Jul 16, 2026 | Indicator Insights
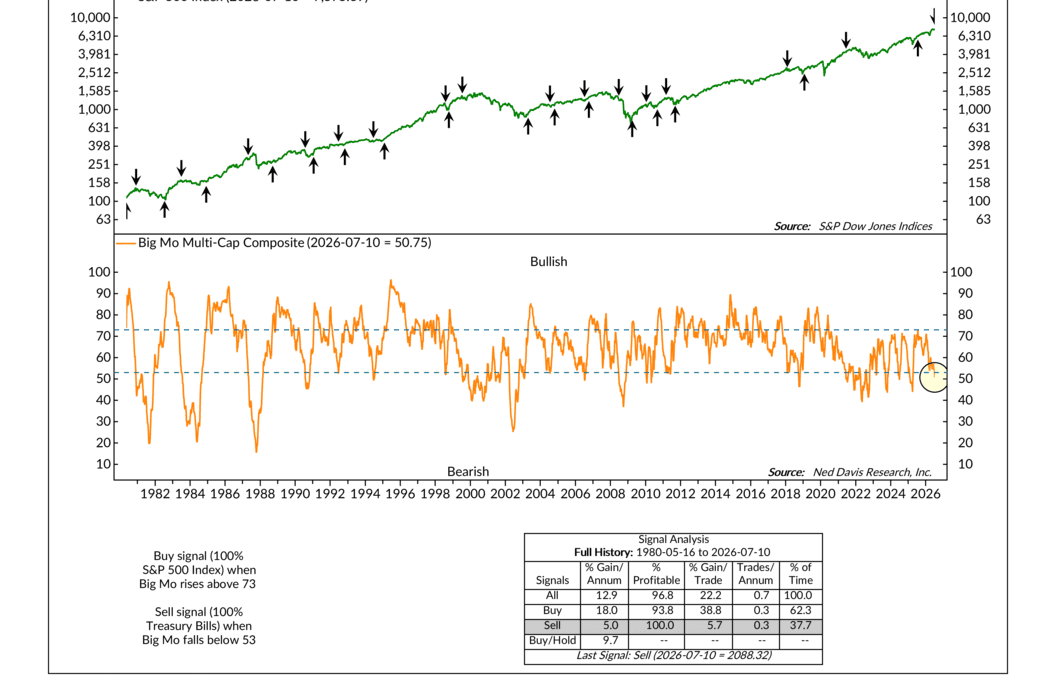
This week we’re talking Big Mo. Big Momentum. It’s an important indicator because it encapsulates exactly the kind of process we prefer to use when building our models. That process is what we call the “weight of the evidence.” The idea is pretty...
by NelsonCorp | Jul 10, 2026 | Indicator Insights
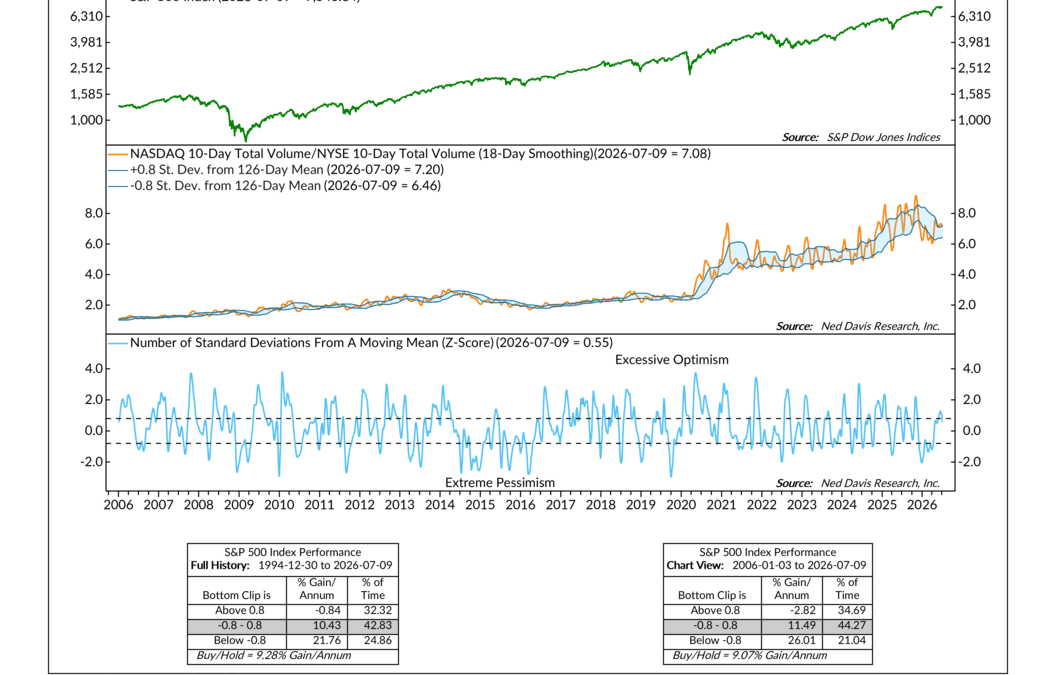
One of the hardest things about investing is separating healthy optimism from outright speculation. Markets need optimism to rise, but when investors become too eager to chase the next hot idea, that enthusiasm can eventually become a warning sign. This...
by NelsonCorp | Jul 2, 2026 | Indicator Insights
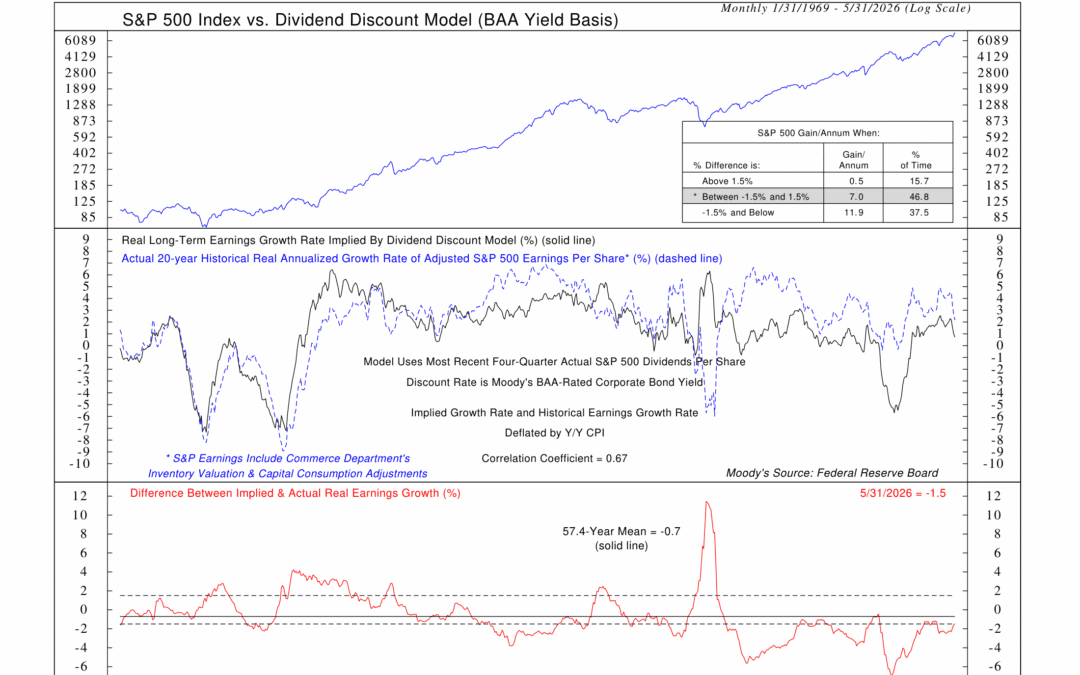
A big challenge in investing is figuring out when stock prices have gotten ahead of reality. It’s a timely question given the excitement surrounding artificial intelligence and the strong rally we’ve seen in U.S. stocks over the past few years. This...
by NelsonCorp | Jun 25, 2026 | Indicator Insights
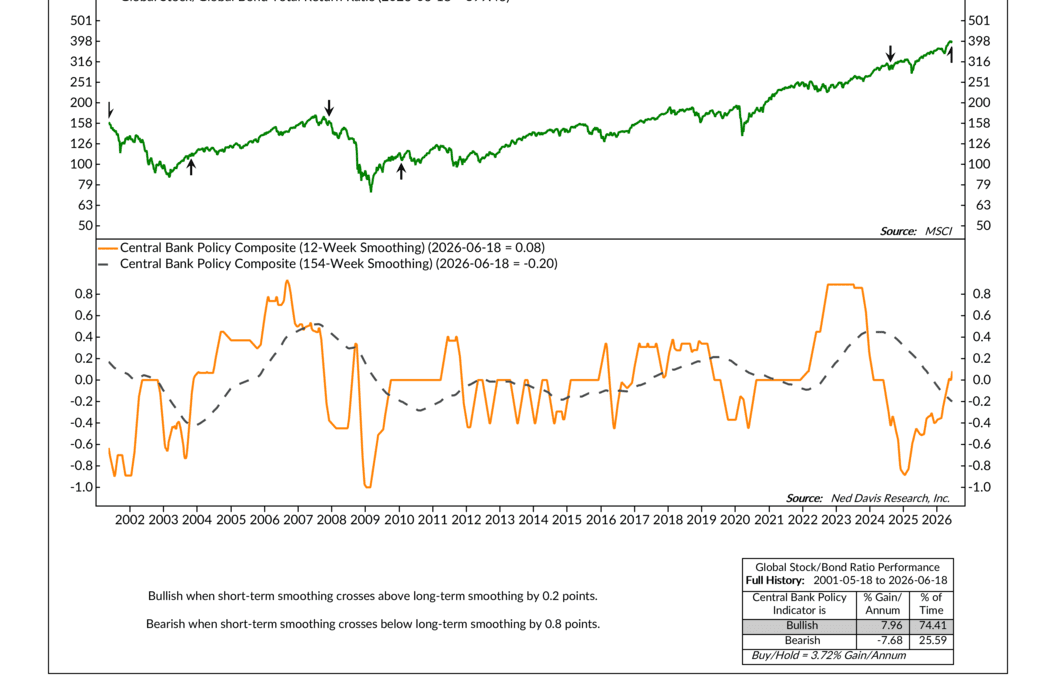
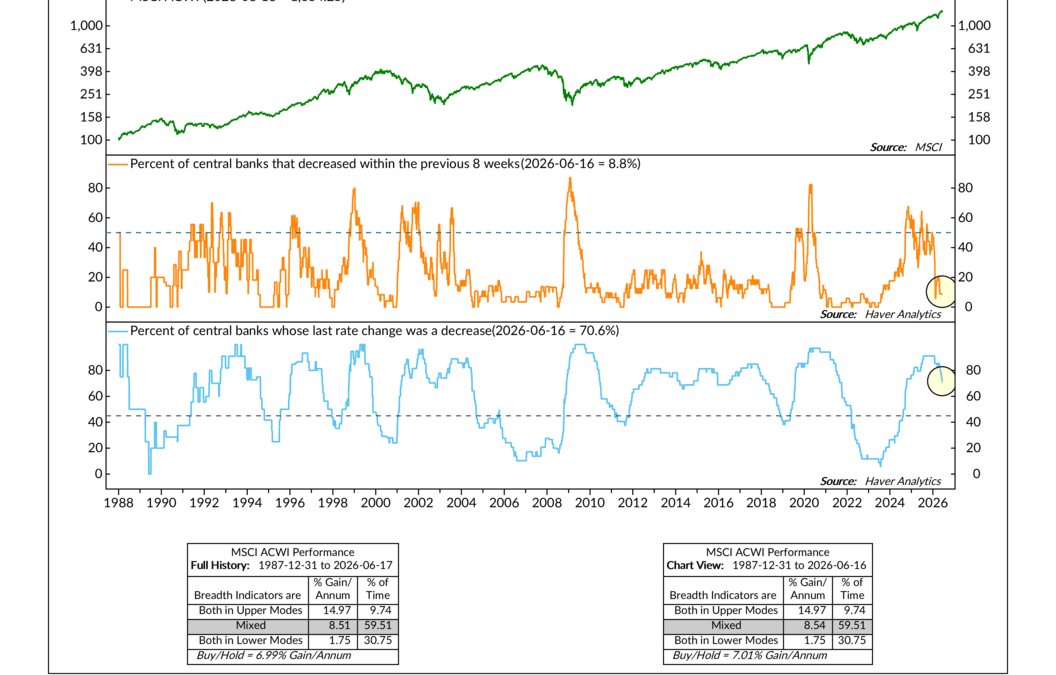
This week, I want to highlight an indicator that interprets the Federal Reserve and its monetary policy actions a bit differently than we’re typically used to. For example, when we usually talk about a “tightening cycle,” it tends to be seen in a negative...
by NelsonCorp | Jun 18, 2026 | Indicator Insights
The Federal Reserve met this week for its first policy meeting under new Chairman Kevin Warsh. The decision to leave interest rates unchanged at 3.50%-3.75% was widely expected and didn’t come as much of a surprise. However, the message coming out of the...
by NelsonCorp | Jun 11, 2026 | Indicator Insights
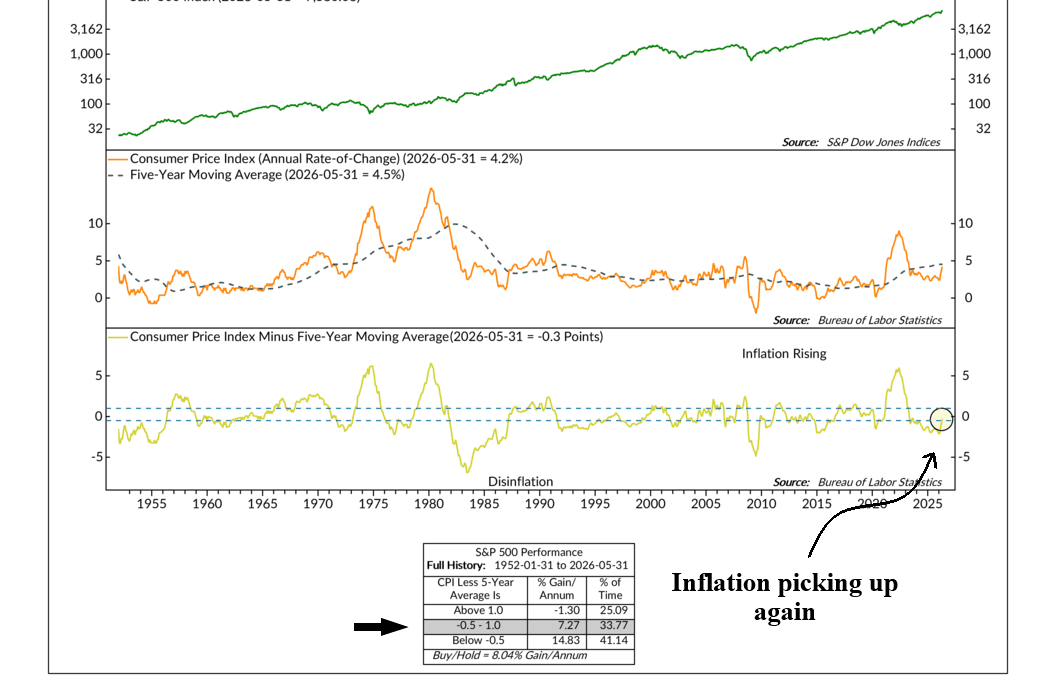
For a while there it looked like inflation was beat. Sure, headline CPI numbers were still elevated relative to historical standards, but at least they were trending lower. And for roughly three years, our composite of inflation indicators remained in bullish...