This week’s chart takes a look at the relationship between stocks and gold, a classic rivalry between growth and safety.
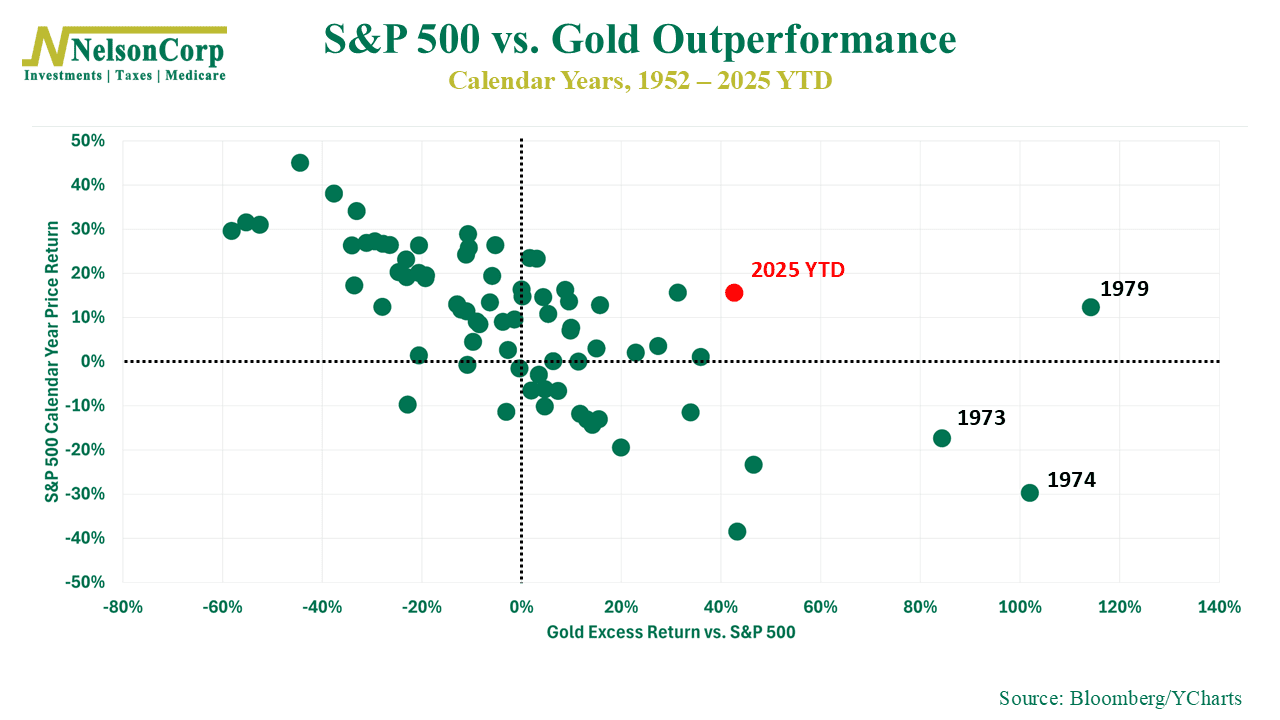
Each dot on the chart represents a calendar year from 1952 through 2025, plotting the S&P 500’s annual price return (vertical axis) against gold’s excess return versus the S&P 500 (horizontal axis).
When dots sit to the right of zero, it means gold outperformed stocks that year. When they’re to the left, stocks came out ahead. Typically, one shines when the other struggles, so you’ll notice most dots slope diagonally from the top left to the bottom right, meaning that strong stock years tend to coincide with weaker gold performance, and vice versa. One might even call this the golden rule of investing.
But there have been a few exceptions—and this year is one of them. As you can see from this year’s red highlighted dot, both assets have posted strong gains so far this year, but gold has outperformed the S&P 500 by a wide margin. That’s pretty rare. In fact, since the index’s inception in 1952, the only other time gold outperformed by this much while stocks were also up double digits was 1979, a period marked by inflation fears, geopolitical tension, and waning faith in central banks.
So, what does this all mean? Well, it likely suggests that investors aren’t fully comfortable with today’s environment. They’re a bit nervous about things, so they’re hedging, so to speak. Sure, stocks are rallying, but there’s still a lot of demand for protection—whether from inflation, fiscal concerns, or uncertainty around interest rates.
The bottom line? Gold tends to glitter when confidence in paper assets flickers. The fact that gold is up and the dollar is down in an otherwise bullish year for equities is a subtle signal that not all is as calm as it seems under the surface.
This is intended for informational purposes only and should not be used as the primary basis for an investment decision. Consult an advisor for your personal situation.
Indices mentioned are unmanaged, do not incur fees, and cannot be invested into directly.
Past performance does not guarantee future results.
The S&P 500 Index, or Standard & Poor’s 500 Index, is a market-capitalization-weighted index of 500 leading publicly traded companies in the U.S.