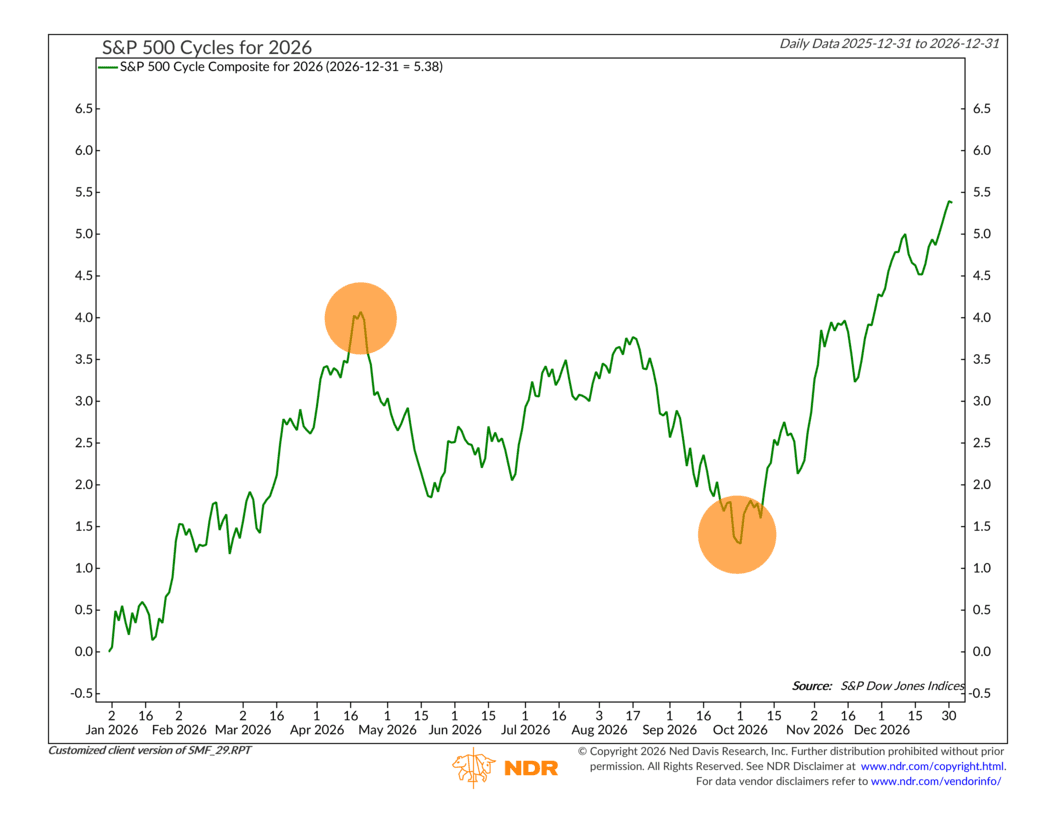
Today officially marks the first day of the new year, so let’s take a look at the NDR Cycle Composite for 2026 to see what the new year has in store for us.
Now, this is one of the tools we use to help set expectations, not to make predictions. It’s based entirely on historical and seasonal patterns. Think of it as a roadmap drawn from past market behavior rather than a forecast of what must happen.
So how does it work? The composite blends three separate cycles. The one-year seasonal cycle captures recurring patterns within a calendar year. The four-year presidential cycle reflects how markets have tended to behave around elections and mid-term years. And the ten-year cycle looks at longer business and credit cycles tied to economic expansions and contractions. When these three are combined, they form the cycle shown in the chart above.
So what does it say for 2026? Short answer: Strength early in the year, some turbulence through the middle, and improvement as the year draws to a close. It looks like April has historically been the high point for the year, followed by a spring or summer pullback. Weakness often persists into late summer or early fall before markets regain their footing toward year-end.
But what’s interesting for this year is the tug-of-war happening between the individual cycles within the composite. The one-year seasonal pattern is relatively constructive and shows only a modest spring pullback. But the four-year presidential cycle is less forgiving. Mid-term years have often been choppier, with weaker returns through the middle of the year and more volatility along the way. And then the ten-year cycle adds another layer, as years ending in six have tended to see softer summer performance before recovering.
The most important takeaway, though, is what this indicator does not say. It’s not calling for a recession, and it’s not signaling a major bear market. It also doesn’t override what’s happening in earnings, interest rates, or investor behavior. Instead, it serves as a reminder that markets rarely move in straight lines, and that mid-year pullbacks are often part of a normal market rhythm.
If the cycle proves even partly correct, 2026 may test patience more than conviction. History suggests that periods of weakness in the middle of the year have often been interruptions rather than endings, but they can still matter for positioning. From our perspective, this is where discipline and flexibility meet. The cycle doesn’t tell us what to do, but it does help frame the environment, especially if volatility or pullbacks emerge. That’s when we rely on our broader models and market evidence to determine whether those periods call for staying the course or making tactical adjustments along the way.
This is intended for informational purposes only and should not be used as the primary basis for an investment decision. Consult an advisor for your personal situation.
Indices mentioned are unmanaged, do not incur fees, and cannot be invested into directly.
Past performance does not guarantee future results.
The S&P 500 Index, or Standard & Poor’s 500 Index, is a market-capitalization-weighted index of 500 leading publicly traded companies in the U.S.