I like to call this week’s featured indicator the “Stay Home or Go Global” indicator. This is because it measures the relative strength of the U.S. stock market versus the global stock market.
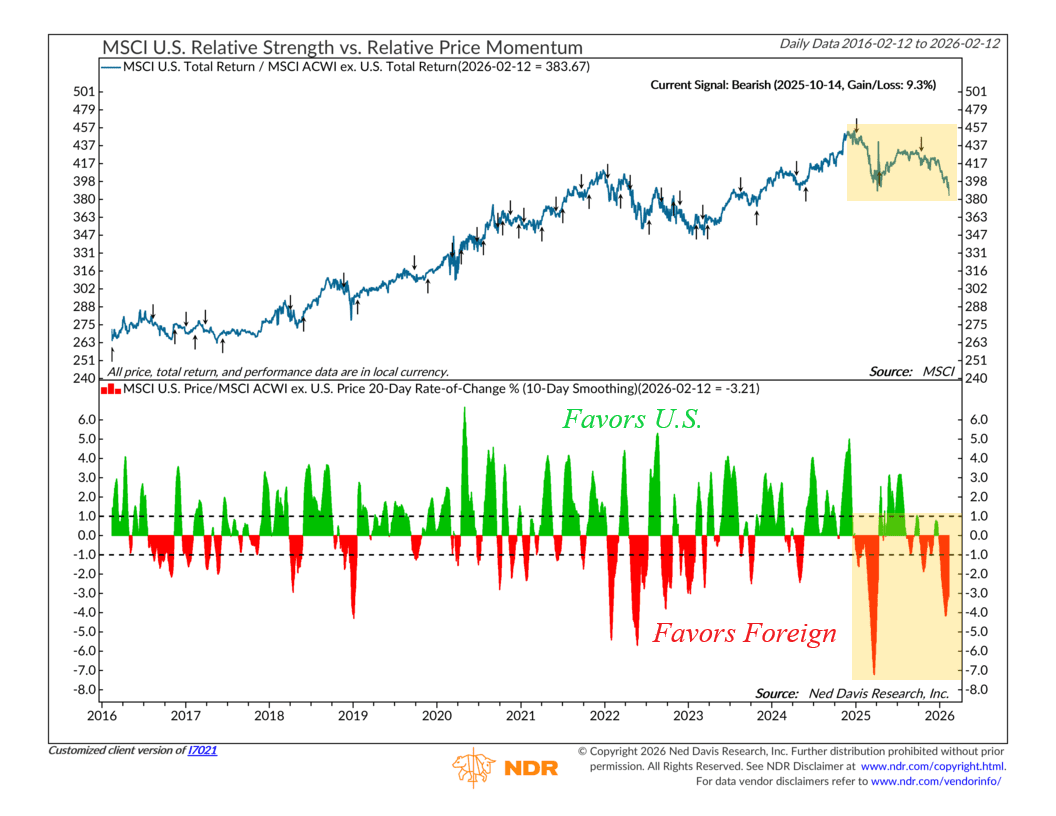
Here’s the basic idea. The top portion of the chart shows the ratio of the MSCI U.S. Total Return Index (U.S. stocks) to the MSCI All Country World Index ex U.S. (foreign stocks). When that ratio is rising, U.S. stocks are outperforming the rest of the world. When it’s falling, international stocks are outperforming.
The bottom portion of the chart generates the actual signal. It measures the 10-day smoothing of the 20-day rate of change of that U.S.-to-international ratio. When this line is rising, it tells us momentum favors the U.S. When it is falling, momentum favors foreign markets. The model turns bullish on the U.S. when the reading moves above 1 percent, and it turns bearish, favoring international stocks, when it drops below negative 1 percent.
For clarity, we are only showing the past 10 years on the chart, but the data goes back to 1995. Since then, the ratio has risen at an annualized pace of 5.3 percent following buy signals, compared to just 1.3 percent following sell signals. Bullish signals have been correct about 64 percent of the time, while bearish signals have been accurate roughly 51 percent of the time.
Now, you’ll probably notice that the ratio has generally trended higher over the long run. That reflects the reality that U.S. stocks have dominated global markets for much of the past decade. However, more recently we have seen meaningful relative strength in foreign stocks. The falling ratio line and several sharp red dips in the indicator highlight that shift.
In fact, since the most recent bearish signal on October 14, 2025, the U.S.-to-international ratio has declined 8.1 percent. In plain terms, foreign stocks have materially outperformed U.S. stocks over that stretch.
This appears to be part of a broader trend that began early last year, when the relative strength of U.S. stocks peaked and has gradually moved lower since.
The bottom line? The leadership baton has been shifting overseas, and until the momentum data turns back up, the evidence suggests that going global may offer the stronger tailwind.
This is intended for informational purposes only and should not be used as the primary basis for an investment decision. Consult an advisor for your personal situation.
Indices mentioned are unmanaged, do not incur fees, and cannot be invested into directly.
Past performance does not guarantee future results.
The MSCI U.S. Index is a market capitalization weighted index designed to measure the performance of the large- and mid-cap segments of the U.S. equity market.
The MSCI ACWI ex USA Index is a market capitalization weighted index designed to measure the performance of large- and mid-cap companies across developed and emerging markets, excluding the United States.