Over the last decade, investing has often felt like “just own U.S. stocks and move on.”
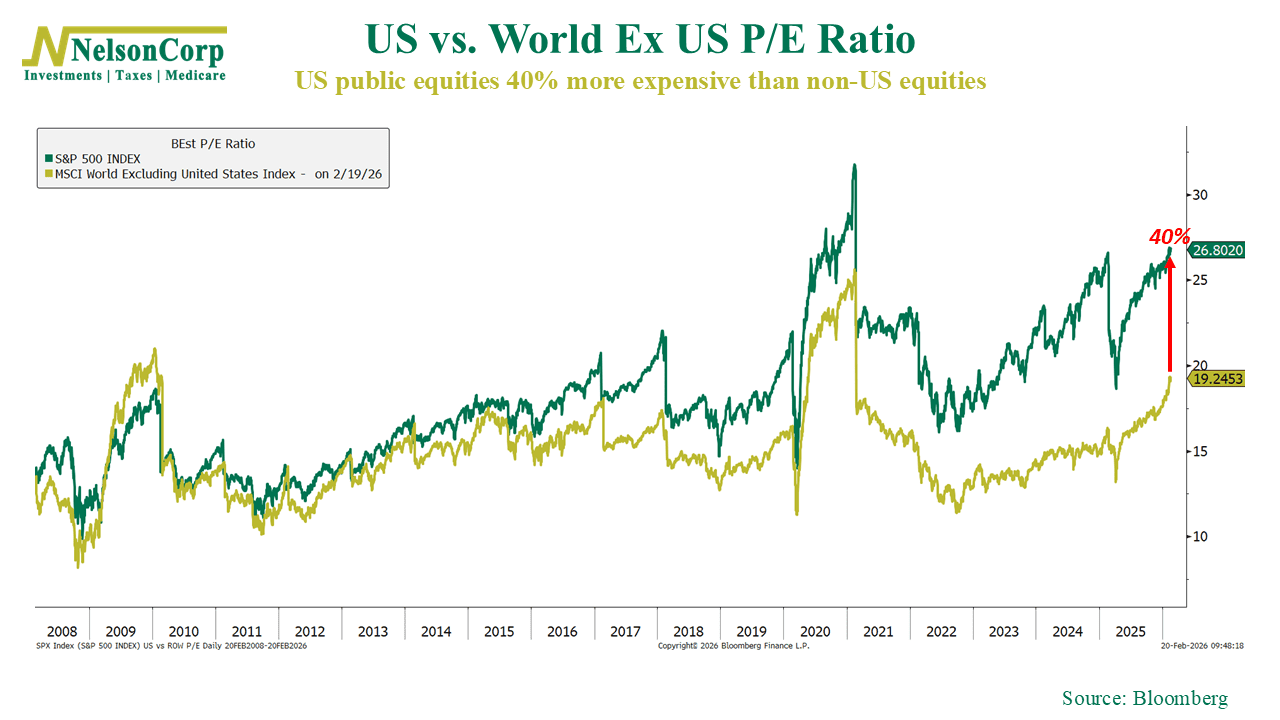
This week’s chart shows why. After the Global Financial Crisis, U.S. and international stocks were valued pretty similarly. But then large-cap tech took off. Earnings were strong, the biggest companies kept delivering, and investors were willing to pay up for that growth. Over time, U.S. valuations pulled ahead.
Today, that translates to U.S. stocks trading at roughly a 40% premium to international stocks, based on forward P/E ratios.
Now, that doesn’t mean the U.S. can’t keep performing. But when one market gets priced this much higher than the rest of the world, future returns often start to even out. International stocks, at the very least, have less headwinds (based on valuations) compared to U.S. based stocks.
The bottom line? After a long stretch of U.S. dominance, this is the kind of setup where having at least some international exposure starts to make a lot of sense.
This is intended for informational purposes only and should not be used as the primary basis for an investment decision. Consult an advisor for your personal situation.
Indices mentioned are unmanaged, do not incur fees, and cannot be invested into directly.
Past performance does not guarantee future results.
The S&P 500 Index, or Standard & Poor’s 500 Index, is a market-capitalization-weighted index of 500 leading publicly traded companies in the U.S.
The MSCI ACWI ex USA Index is a market capitalization weighted index designed to measure the performance of large- and mid-cap companies across developed and emerging markets, excluding the United States.