There’s a saying on Wall Street that says you should always “keep the trend your friend.” What is generally meant by that is whatever the market is doing from a price standpoint, you should probably try and follow along with it. In other words, don’t fight it. Keep the trend your friend.
But that can be hard to do in practice. Maybe you have your own idea as to where prices should go, or be? That’s fine. But at the end of the day, the only real fact you can truly rely upon is the price trend you see on the screen.
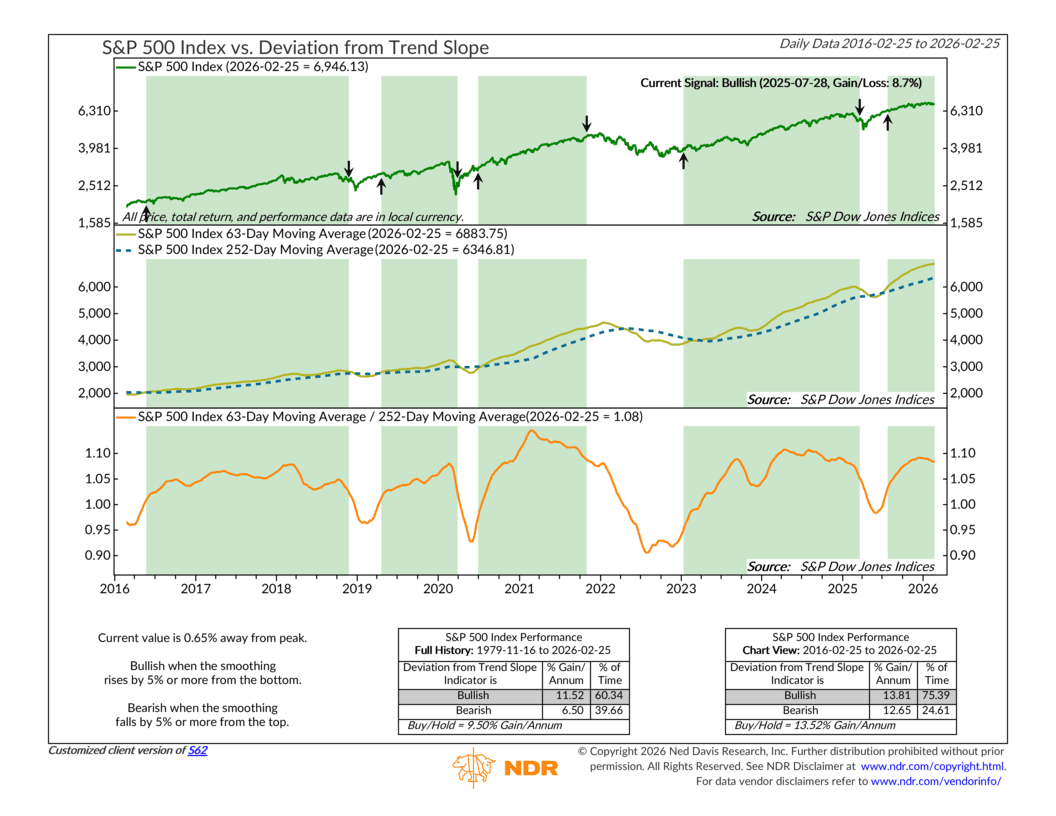
That’s where this week’s indicator comes into play. It measures the stock market’s trend, plain and simple.
It does this by combining two simple technical measures. The first is the 63-day moving average of the S&P 500 Index. Think of that as the market’s average price over roughly the past three months. The second is the 252-day moving average, which captures the market’s average price over the past year. Shorter term versus longer term.
Those two series are shown on the middle clip of the chart (the S&P 500 is in the top clip). The third clip, on the very bottom, is where we combine the two technical moving averages into one indicator—called a Deviation from Trend Slope. It sounds daunting, but all we’re doing here is taking the shorter-term moving average (63 days) and dividing it by the longer-term moving average (252 days).
I like to call it the “Hilly Indicator.”
That’s because when you chart that ratio over time, it forms rolling slopes that look like hills. And just like a real hill, once you start heading down and pick up enough momentum, there comes a point where it’s hard to stop.
The indicator turns bullish when the ratio rises 5 percent or more from a prior bottom. It turns bearish when it falls 5 percent or more from a prior peak. The green shaded areas on the chart mark bullish periods. The unshaded areas represent bearish stretches.
Sure enough, as the performance box shows, green-shaded bullish periods have historically produced strong returns, while unshaded bearish phases have seen weaker performance and more frequent drawdowns.
Right now, we’re still in a bullish, green-shaded phase. However, the slope has begun to roll over. We are not close to the 5 percent downside trigger yet, but it is something to monitor.
For now, the trend remains our friend. But the Hilly Indicator will be on our radar going forward, because the longer downside pressures persist in the market, the closer we get to reaching that point of no return where the hill drags us down with it.
This is intended for informational purposes only and should not be used as the primary basis for an investment decision. Consult an advisor for your personal situation.
Indices mentioned are unmanaged, do not incur fees, and cannot be invested into directly.
Past performance does not guarantee future results.
The S&P 500 Index, or Standard & Poor’s 500 Index, is a market-capitalization-weighted index of 500 leading publicly traded companies in the U.S.