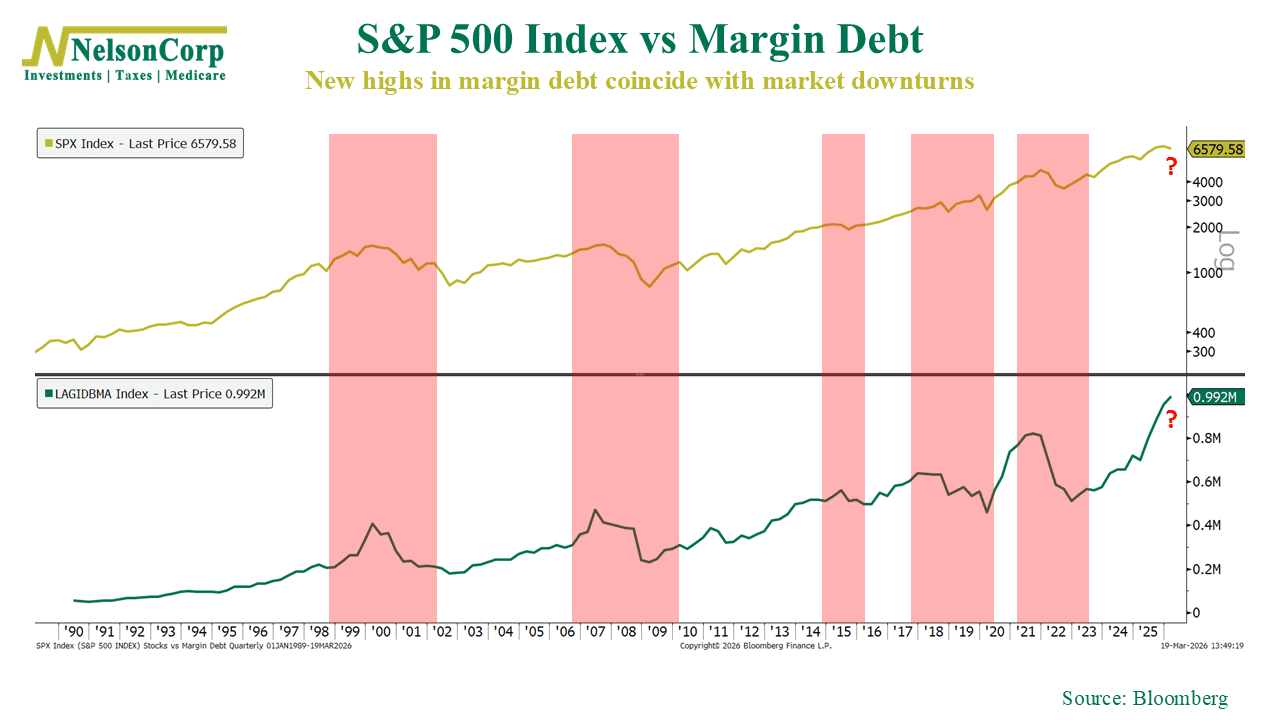
Too much debt can create problems. That’s true for individuals, corporations, and—it turns out—even the stock market. This week’s chart illustrates why.
The chart above compares the S&P 500 stock index (gold line, top) to margin debt levels (green line, bottom) going back to the 1990s. Margin debt represents the amount investors borrow in their brokerage accounts to buy stocks.
That borrowing can become an issue when markets start to fall. As prices decline, investors using leverage can face margin calls, forcing them to quickly raise cash. In many cases, that means selling stocks, which can add fuel to the downturn.
On the chart, I’ve highlighted how eerie this relationship has been in the past. Historically, when margin debt reaches new highs, the market has often gone on to experience a drawdown. And the most severe bear markets over the past few decades have all followed major peaks in margin debt.
That’s what makes the current environment so concerning. Margin debt has climbed back to record levels in recent months. Volatility in the market has also started to pick up. Again, it’s not that margin debt causes declines on its own, but it can amplify the downturns once selling begins, as leveraged investors are forced to unwind positions.
The bottom line? Elevated leverage and high levels of margin debt tend to raise the stakes. Historically, this has created sharper and more disorderly downturns when stocks start to fall, so it’s something to keep an eye on over the next few weeks.
This is intended for informational purposes only and should not be used as the primary basis for an investment decision. Consult an advisor for your personal situation.
Indices mentioned are unmanaged, do not incur fees, and cannot be invested into directly.
Past performance does not guarantee future results.
The S&P 500 Index, or Standard & Poor’s 500 Index, is a market-capitalization-weighted index of 500 leading publicly traded companies in the U.S.