Go with the flow, until it reaches an extreme. That’s the concept behind this week’s indicator. I like to call it the Chicago Indicator because it measures the Bulls / (Bulls + Bears) ratio. You know, because the two major sports teams in Chicago are the Bulls and the Bears.
Anyway, in this context we’re not talking about sports, but rather bullish and bearish investors. If you’ve never heard those terms before, bullish simply means investors are optimistic about the stock market, while bearish means investors are pessimistic. We can use this information to develop a sentiment indicator, which is exactly what this week’s chart does.
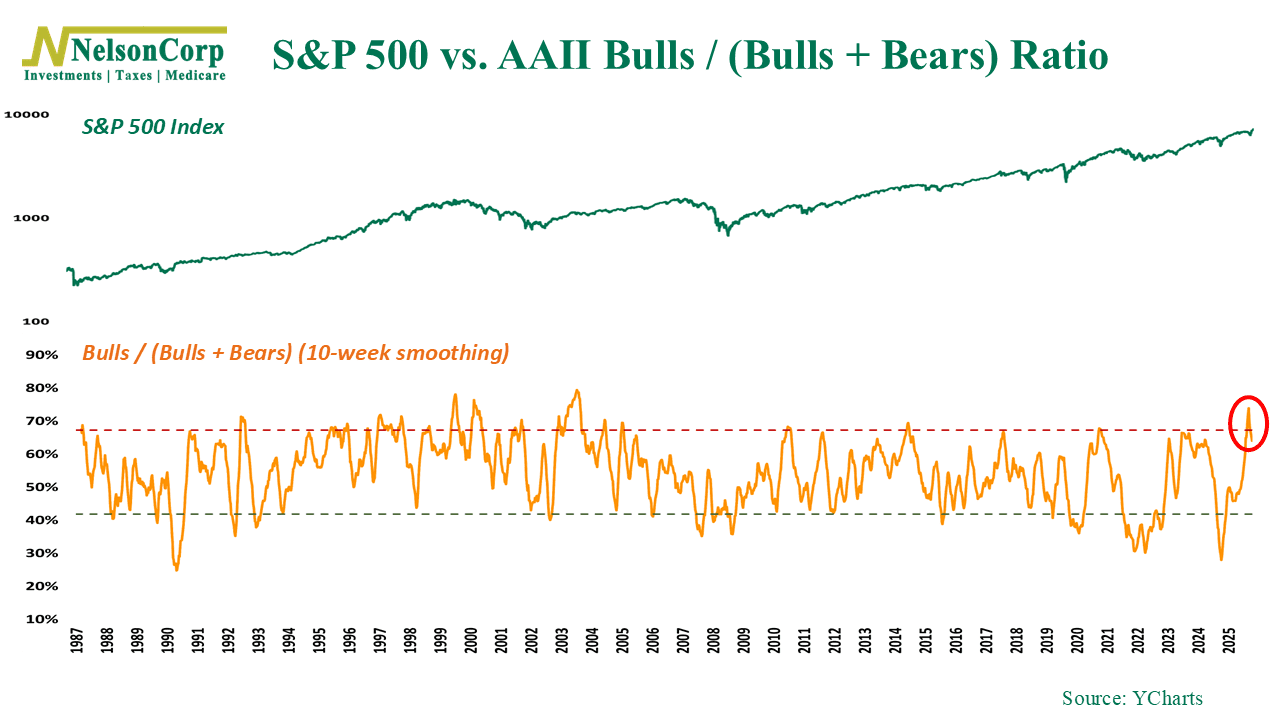
It does this through the American Association of Individual Investors survey. This is a poll that has surveyed stock market newsletter editors since 1987. Every week, roughly 130 newsletters are classified as either bullish or bearish. The indicator simply tracks the ratio of bulls to bulls plus bears. In general, when that number climbs high, professional commentators are broadly optimistic. When it falls, they’ve turned broadly cautious.
Now this is what we call a contrarian indicator, because it tells us to lean in the opposite direction of the crowd. Sure, we like to go with the flow or momentum of the prevailing market trend, but when sentiment toward that momentum reaches an extreme, either too optimistic or too pessimistic, it usually makes sense to lean the other way.
The historical numbers back this up. Going back to 1987, when the 10-week moving average has been above 67%, the subsequent 26-week S&P 500 return has averaged just 1.64%. But when it has been below 42%, that same forward return has averaged 13.13%—a massive difference. In other words, the crowd tends to be most bullish near tops and most bearish near bottoms.
Why does this work exactly? Well, there are various reasons contrarian investing tends to work, but in this case, it likely boils down to the fact that when consensus becomes too lopsided, the buying or selling behind that view has already happened. The stock market moves quickly. It’s relentless. And by the time newsletter editors and other investors are writing about a market trend, there’s a good chance the market itself has already begun looking ahead to what comes next.
Ok, so where does the indicator stand today? Well currently, the ratio is sitting at around 65%. It recently dropped below the 67% threshold that signals a “sell” signal for the market. That’s a bit concerning given the market’s recent run to all-time highs.
The bottom line is that although sentiment alone rarely drives the market, it can still tell us a lot about the environment investors are operating in. Right now, optimism remains elevated, even after this recent reversal in the indicator. That doesn’t necessarily mean a major decline is right around the corner, but it does suggest expectations are still fairly high. And historically, when everyone is leaning too heavily in one direction, the market has a way of reminding investors that surprises tend to come from the other side.
This is intended for informational purposes only and should not be used as the primary basis for an investment decision. Consult an advisor for your personal situation.
Indices mentioned are unmanaged, do not incur fees, and cannot be invested into directly.
Past performance does not guarantee future results.
The S&P 500 Index, or Standard & Poor’s 500 Index, is a market-capitalization-weighted index of 500 leading publicly traded companies in the U.S.