This week’s indicator is all about options. Financial options, to be exact. The most common options investors use are Puts and Calls. A Call option gives you the right, but not the obligation, to buy a financial product at a set price by a certain date. A Put option is simply the opposite, it gives you the right to sell.
So why are we talking about options? Because options traders have a well-documented tendency to be wrong at extremes. We’ve talked about this idea of contrarian investing before, and this is simply another version of that concept. When the crowd gets too excited or too pessimistic, they tend to be wrong, and that can create opportunity.
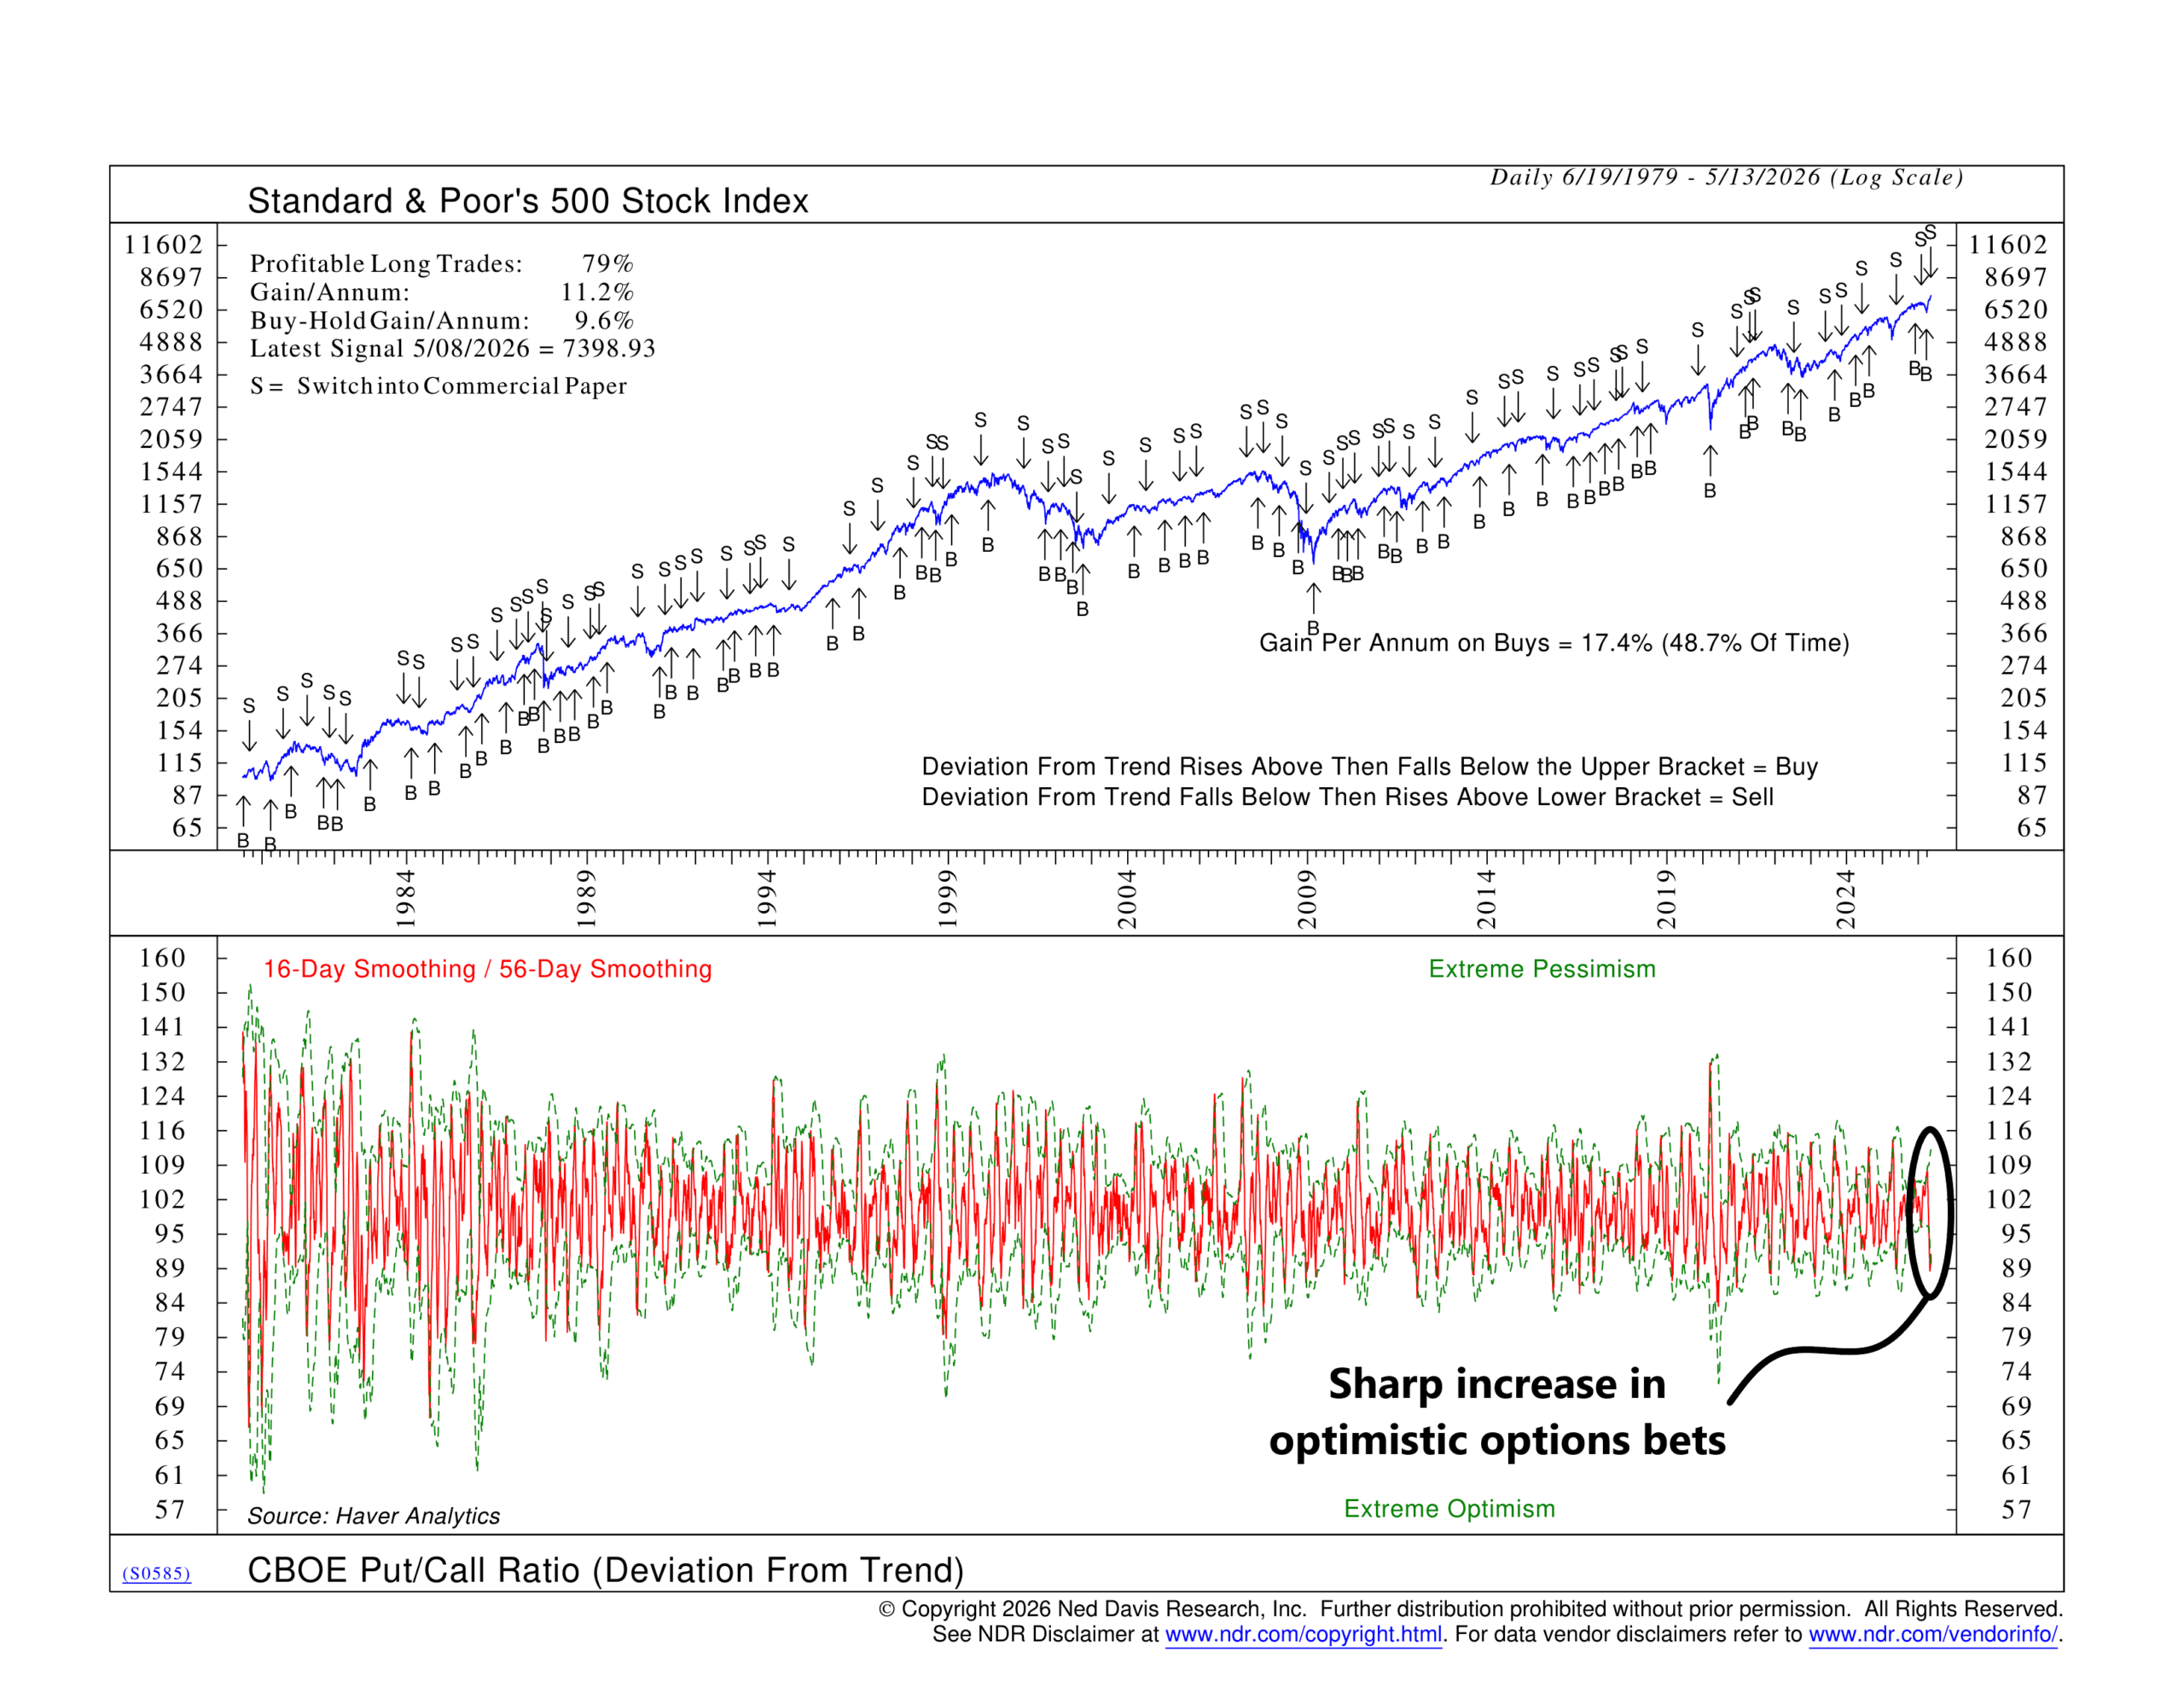
How? By looking at the CBOE Put/Call Ratio. This metric tracks the volume of put options (bearish bets) relative to call options (bullish bets) traded each day on the Chicago Board Options Exchange. That distinction is key because, unlike surveys that measure what investors say, this indicator measures what they’re actually doing with real money at stake.
The way it typically works is that when the ratio drops sharply, call buying has surged, signaling that speculative traders have turned aggressively optimistic. When it spikes, the opposite is true.
But this specific indicator uses a “deviation from trend” calculation. In simple terms, it compares a shorter moving average of the put/call ratio to a longer one, creating a ratio that strips out long-term trends and focuses on shorter-term swings in positioning. Bollinger Bands, which are moving brackets that adjust with the data’s own volatility, then identify when those swings have reached a genuine extreme.
A drop below the lower band signals excessive optimism. A rise above the upper band signals excessive pessimism. In both cases, history says a reversal is likely.
Historically, these signals have translated into solid performance numbers. The strategy has outperformed a buy-and-hold approach by roughly 1.6 percentage points and has produced profitable long trades 79% of the time. The S&P 500’s average annualized gain following a buy signal has been around 17.4%.
But the real value of this indicator lies not in its standalone performance, but in how it fits within our broader stock market risk model. It sits inside the Investor Positioning sub-composite of our Investor Behavior model, alongside indicators like margin debt, mutual fund flows, ETF speculation data, and inverse ETF flows. These positioning indicators are very important to the model because, unlike survey-based sentiment measures, they track what investors are actually doing with their money.
You know the saying, “put your money where your mouth is.” That’s exactly what this indicator is designed to capture.
This is intended for informational purposes only and should not be used as the primary basis for an investment decision. Consult an advisor for your personal situation.
Indices mentioned are unmanaged, do not incur fees, and cannot be invested into directly.
Past performance does not guarantee future results.
The S&P 500 Index, or Standard & Poor’s 500 Index, is a market-capitalization-weighted index of 500 leading publicly traded companies in the U.S.