For a while there it looked like inflation was beat. Sure, headline CPI numbers were still elevated relative to historical standards, but at least they were trending lower. And for roughly three years, our composite of inflation indicators remained in bullish territory, until now.
This week, we learned that year-over-year inflation rose to 4.2% in May, the highest reading in three years. As a result, we’re beginning to see our inflation indicators move in the wrong direction again.
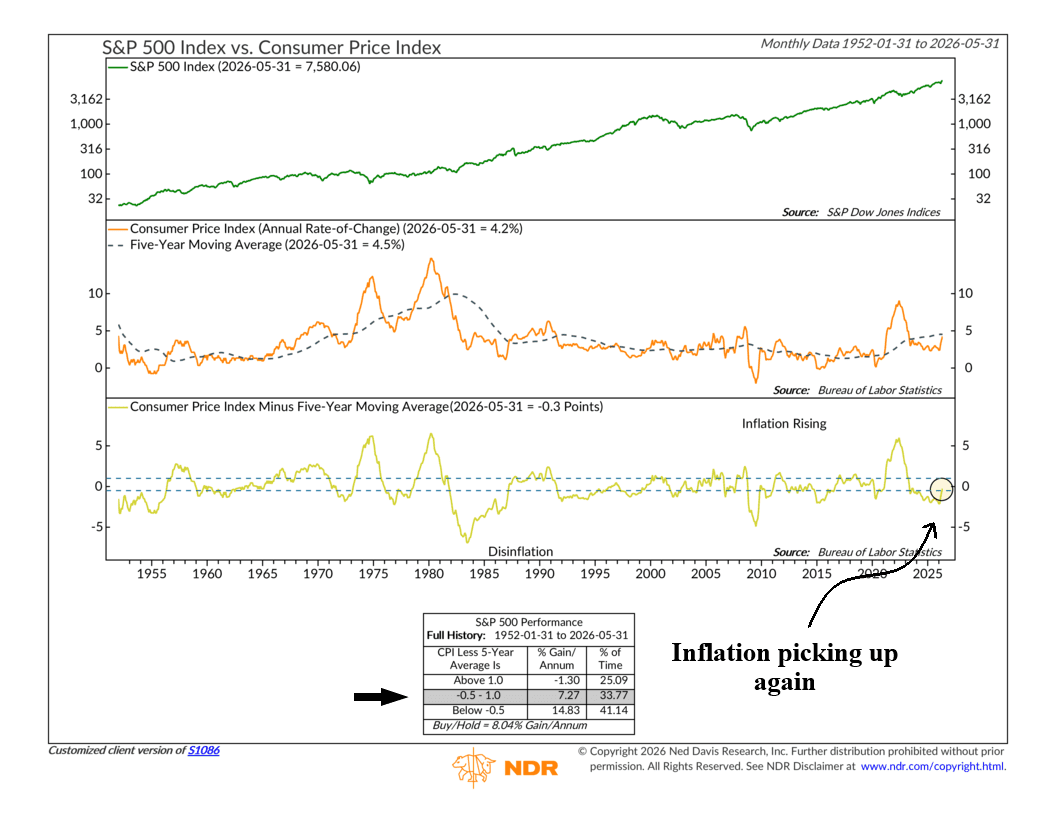
For example, our featured indicator this week tracks the annual rate of change in the Consumer Price Index (currently 4.2%) and compares it to its five-year moving average (currently 4.5%). That’s a difference of -0.3 percentage points, which moves the indicator into Neutral territory (see bottom clip and performance box on the chart above).
Why is this relevant? Because earlier this year, that gap was as wide as -2 percentage points—and in the lower bullish zone for stock prices. Historically, when the indicator has been in that zone, the S&P 500 (top clip) has risen at an annualized rate of roughly 15%. In the neutral zone, where it sits today, stocks have still tended to move higher, but at a much more average annualized rate of 7.27%.
Now, that’s not bad. It’s just average. Average can still be fine here. But when taken together with the other deteriorating inflation indicators that we track, it certainly starts to become a major headwind for our Macro-Economic Composite.
The bottom line? Inflation is not flashing an outright warning sign yet, but the trend is becoming less favorable. Stocks have historically continued to generate positive returns in environments like today’s, just at a slower pace than when inflation pressures are easing. The risk? If inflation continues to drift higher from here, it could become a bigger obstacle for both the economy and the market in the months ahead.
This is intended for informational purposes only and should not be used as the primary basis for an investment decision. Consult an advisor for your personal situation.
Indices mentioned are unmanaged, do not incur fees, and cannot be invested into directly.
Past performance does not guarantee future results.
The S&P 500 Index, or Standard & Poor’s 500 Index, is a market-capitalization-weighted index of 500 leading publicly traded companies in the U.S.