
One of the hardest things about investing is separating healthy optimism from outright speculation. Markets need optimism to rise, but when investors become too eager to chase the next hot idea, that enthusiasm can eventually become a warning sign.
This week’s indicator attempts to measure exactly that.
Rather than looking at stock prices, it looks at where investors are trading. Specifically, it compares the amount of trading volume on the NASDAQ to the amount of trading volume on the NYSE. Because the NASDAQ is home to many of the market’s fastest-growing technology and speculative companies, while the NYSE has historically housed more mature, established businesses, shifts in this ratio can tell us quite a bit about investor behavior.
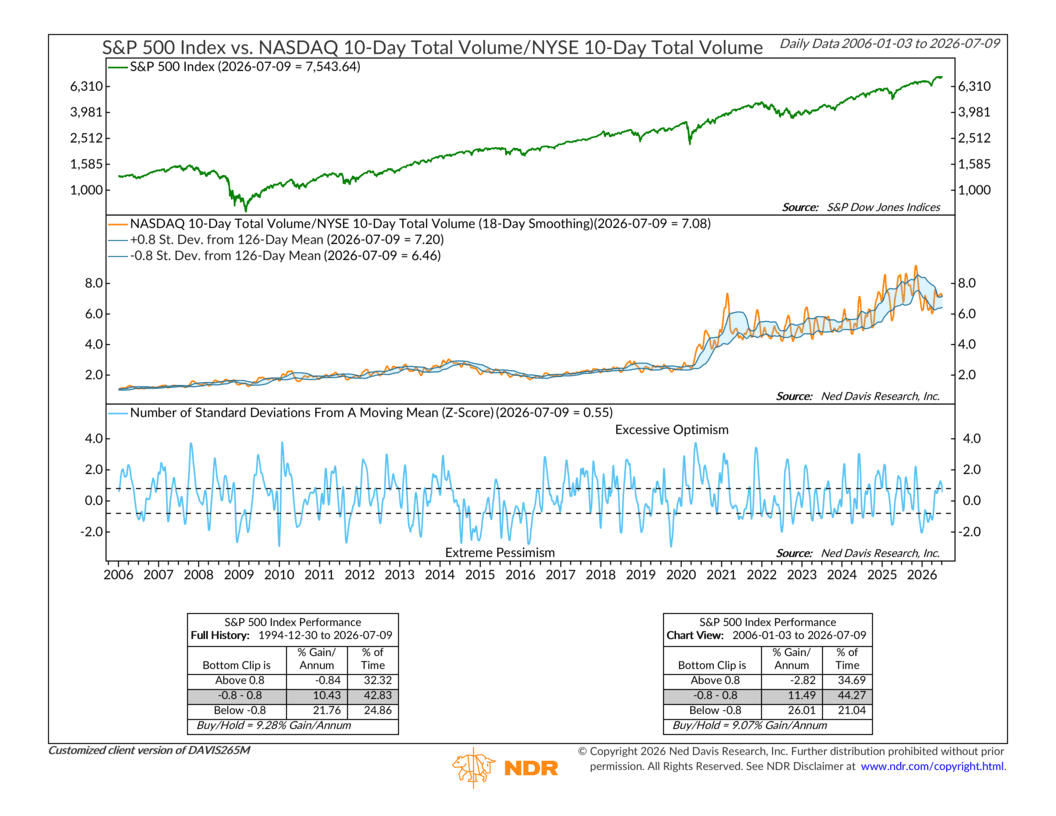
The orange line on the chart shows the 10-day total NASDAQ volume divided by the 10-day total NYSE volume, while the blue band represents the indicator’s moving average and expected range. The bottom panel converts that relationship into a z-score, showing how far today’s reading sits above or below its own recent history. Readings above +0.8 suggest unusually strong enthusiasm for speculative stocks, while readings below -0.8 typically coincide with periods of widespread pessimism.
Historically, this has been a useful contrary indicator. When investors overwhelmingly favored NASDAQ trading over the NYSE, future stock market returns tended to be below average. Conversely, when investors shunned speculative stocks and the ratio fell well below normal, long-term returns were often strongest. The performance table at the bottom of the chart illustrates this relationship.
One of the most interesting features of this chart, however, is what happened after 2020.
Notice how the entire ratio shifted into a much higher range. Before 2020, readings above 3 were unusual. Since then, values between roughly 5 and 8 have become commonplace. Several structural changes likely contributed to this new regime: commission-free trading became nearly universal, retail participation exploded during the pandemic, options activity surged, ETFs became an even larger share of trading activity, and technology companies continued to dominate both market capitalization and investor attention. In other words, today’s market naturally generates much more NASDAQ trading than it did a decade ago. That makes comparing today’s raw ratio with 2015 less meaningful, which is why the indicator focuses on deviations from its own recent trend rather than the absolute level.
Today, the indicator sits at a z-score of 0.55. That’s above average, but still below the +0.8 threshold that has historically signaled excessive optimism. In fact, after spending much of the past year flirting with more elevated readings, the ratio has cooled modestly in recent weeks. Investors continue to favor growth and technology shares, but not to the same extreme levels seen earlier this year.
The key takeaway is that this isn’t an indicator designed to predict tomorrow’s market move. Instead, it provides insight into investor psychology. When trading activity becomes overwhelmingly concentrated in speculative areas of the market, expectations often become difficult to exceed. On the other hand, when investors abandon those same areas and pessimism becomes widespread, future opportunities have historically been much better.
At the moment, the message appears fairly balanced. Enthusiasm for growth stocks remains healthy, but it hasn’t yet reached the type of speculative extreme that has historically warranted greater caution. Like most sentiment indicators, this is best viewed as one piece of the puzzle rather than a standalone market timing tool—but it’s a useful reminder that how investors are behaving can sometimes be just as important as what the market itself is doing.
This is intended for informational purposes only and should not be used as the primary basis for an investment decision. Consult an advisor for your personal situation.
Indices mentioned are unmanaged, do not incur fees, and cannot be invested into directly.
Past performance does not guarantee future results.
The S&P 500 Index, or Standard & Poor’s 500 Index, is a market-capitalization-weighted index of 500 leading publicly traded companies in the U.S.