
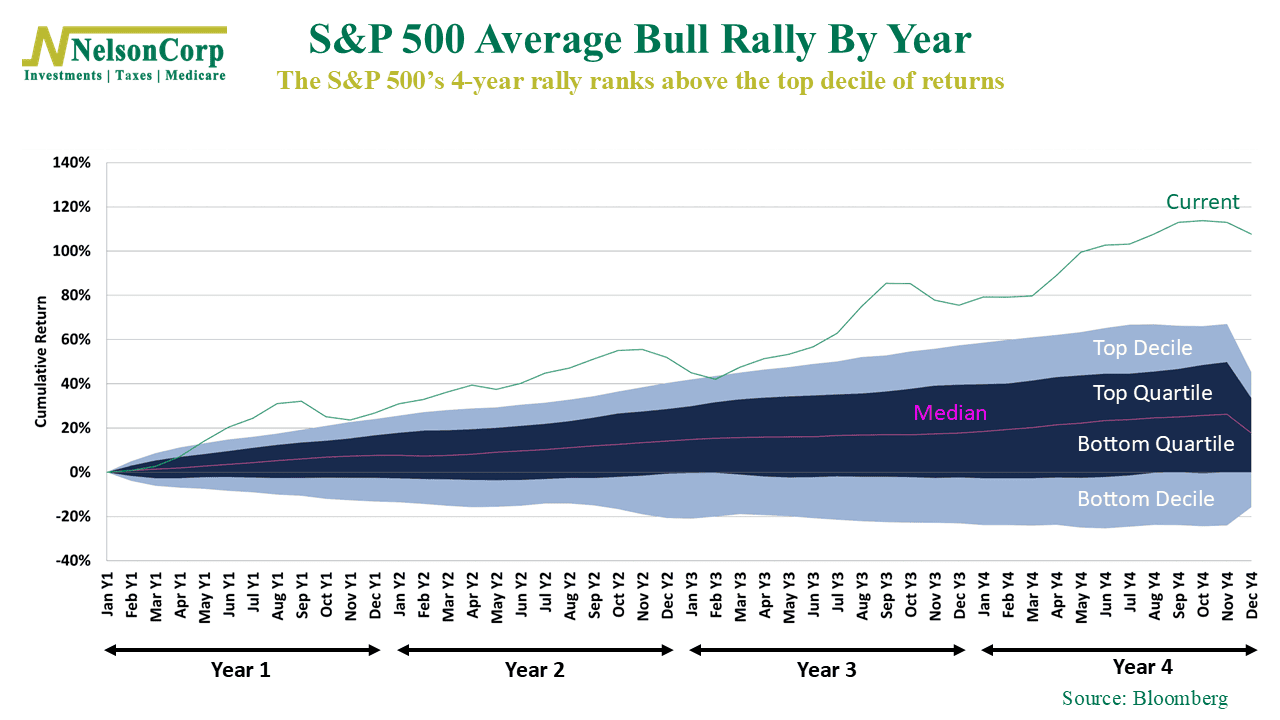
The stock market has rewarded investors handsomely over the past four years. It kind of makes you wonder: just how unusual has this rally been?
The green line shows the S&P 500’s cumulative return over the current four-year rally, while the shaded bands represent the historical distribution of every other four-year period since 1928. The purple line marks the median (average) outcome, and the darker and lighter blue bands show progressively stronger and weaker historical returns.
As you can see, today’s rally has climbed above the top decile, placing it among the strongest 10% of four-year advances on record.
That’s really strong. At first glance, that might sound like a reason for caution. But history suggests strong bull markets don’t end just because they’ve already produced big returns. More often, they end when the underlying fundamentals weaken.
Therefore, corporate earnings will continue to be key. As long as earnings grow, the market has the potential to move higher—despite elevated valuations, narrow leadership, and the inevitable bouts of volatility that come with investing.
The bottom line? This has been one of the strongest four-year rallies in nearly a century. While that doesn’t guarantee future gains, history reminds us that strength alone isn’t a reason to abandon a bull market.
This is intended for informational purposes only and should not be used as the primary basis for an investment decision. Consult an advisor for your personal situation.
Indices mentioned are unmanaged, do not incur fees, and cannot be invested into directly.
Past performance does not guarantee future results.
The S&P 500 Index, or Standard & Poor’s 500 Index, is a market-capitalization-weighted index of 500 leading publicly traded companies in the U.S.