
Stocks or bonds? It’s a simple question, but the answer isn’t always so simple. Most of the time, investors will want to own some of both. But when the evidence becomes strong enough, it can make sense to lean more heavily in one direction.
So, how do we know when the evidence is strong enough? This week’s indicator provides one useful answer. It uses a technical tool called a stochastic to measure the strength of the U.S. stock market over the past nine months.
Here’s how it works.
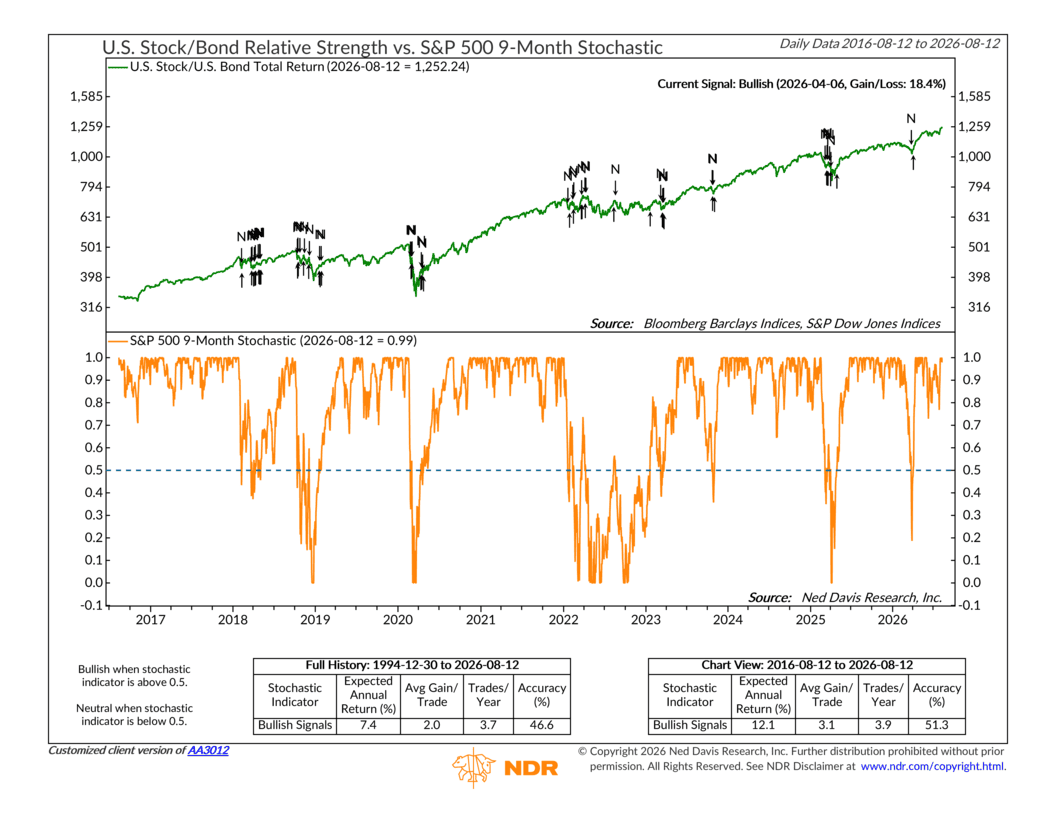
The orange line in the bottom half of the chart is the S&P 500’s 9-month stochastic. Without getting too deep into the math, the stochastic measures where the stock market is trading relative to its high and low over the past nine months. A reading near 1.0 means stocks are near the top of that range, while a reading near zero means they are near the bottom.
For this indicator, the key level is 0.5, represented by the dashed blue line. When the stochastic is above 0.5, the indicator turns bullish on stocks relative to bonds. When it falls below 0.5, the signal shifts to neutral.
Now, for reference, the blue line in the top half of the chart shows the cumulative performance of U.S. stocks relative to U.S. bonds. When the line rises, stocks are outperforming bonds. When it falls, bonds are outperforming stocks.
Historically, the stochastic has done a pretty good job of identifying periods when stocks have had the upper hand. Since 1994, bullish signals have produced an average gain of 2.0% per trade in the stock-to-bond ratio, with an expected annual return of 7.4%. Over the past decade, the results have been even stronger, with bullish signals producing an expected annual return of 12.1%.
Right now, the message is about as strong as it gets. The 9-month stochastic sits at 0.99, well above the bullish threshold. The current bullish signal began on April 6, and since then, stocks have outperformed bonds by roughly 18%.
That doesn’t mean investors should abandon bonds altogether. Diversification still matters, and no indicator gets every signal right. But when momentum is this strong, history suggests it has generally paid to lean toward stocks.
For now, the Fantastic Stochastic is giving stocks the edge.
This is intended for informational purposes only and should not be used as the primary basis for an investment decision. Consult an advisor for your personal situation.
Indices mentioned are unmanaged, do not incur fees, and cannot be invested into directly.
Past performance does not guarantee future results.
The S&P 500 Index, or Standard & Poor’s 500 Index, is a market-capitalization-weighted index of 500 leading publicly traded companies in the U.S.