
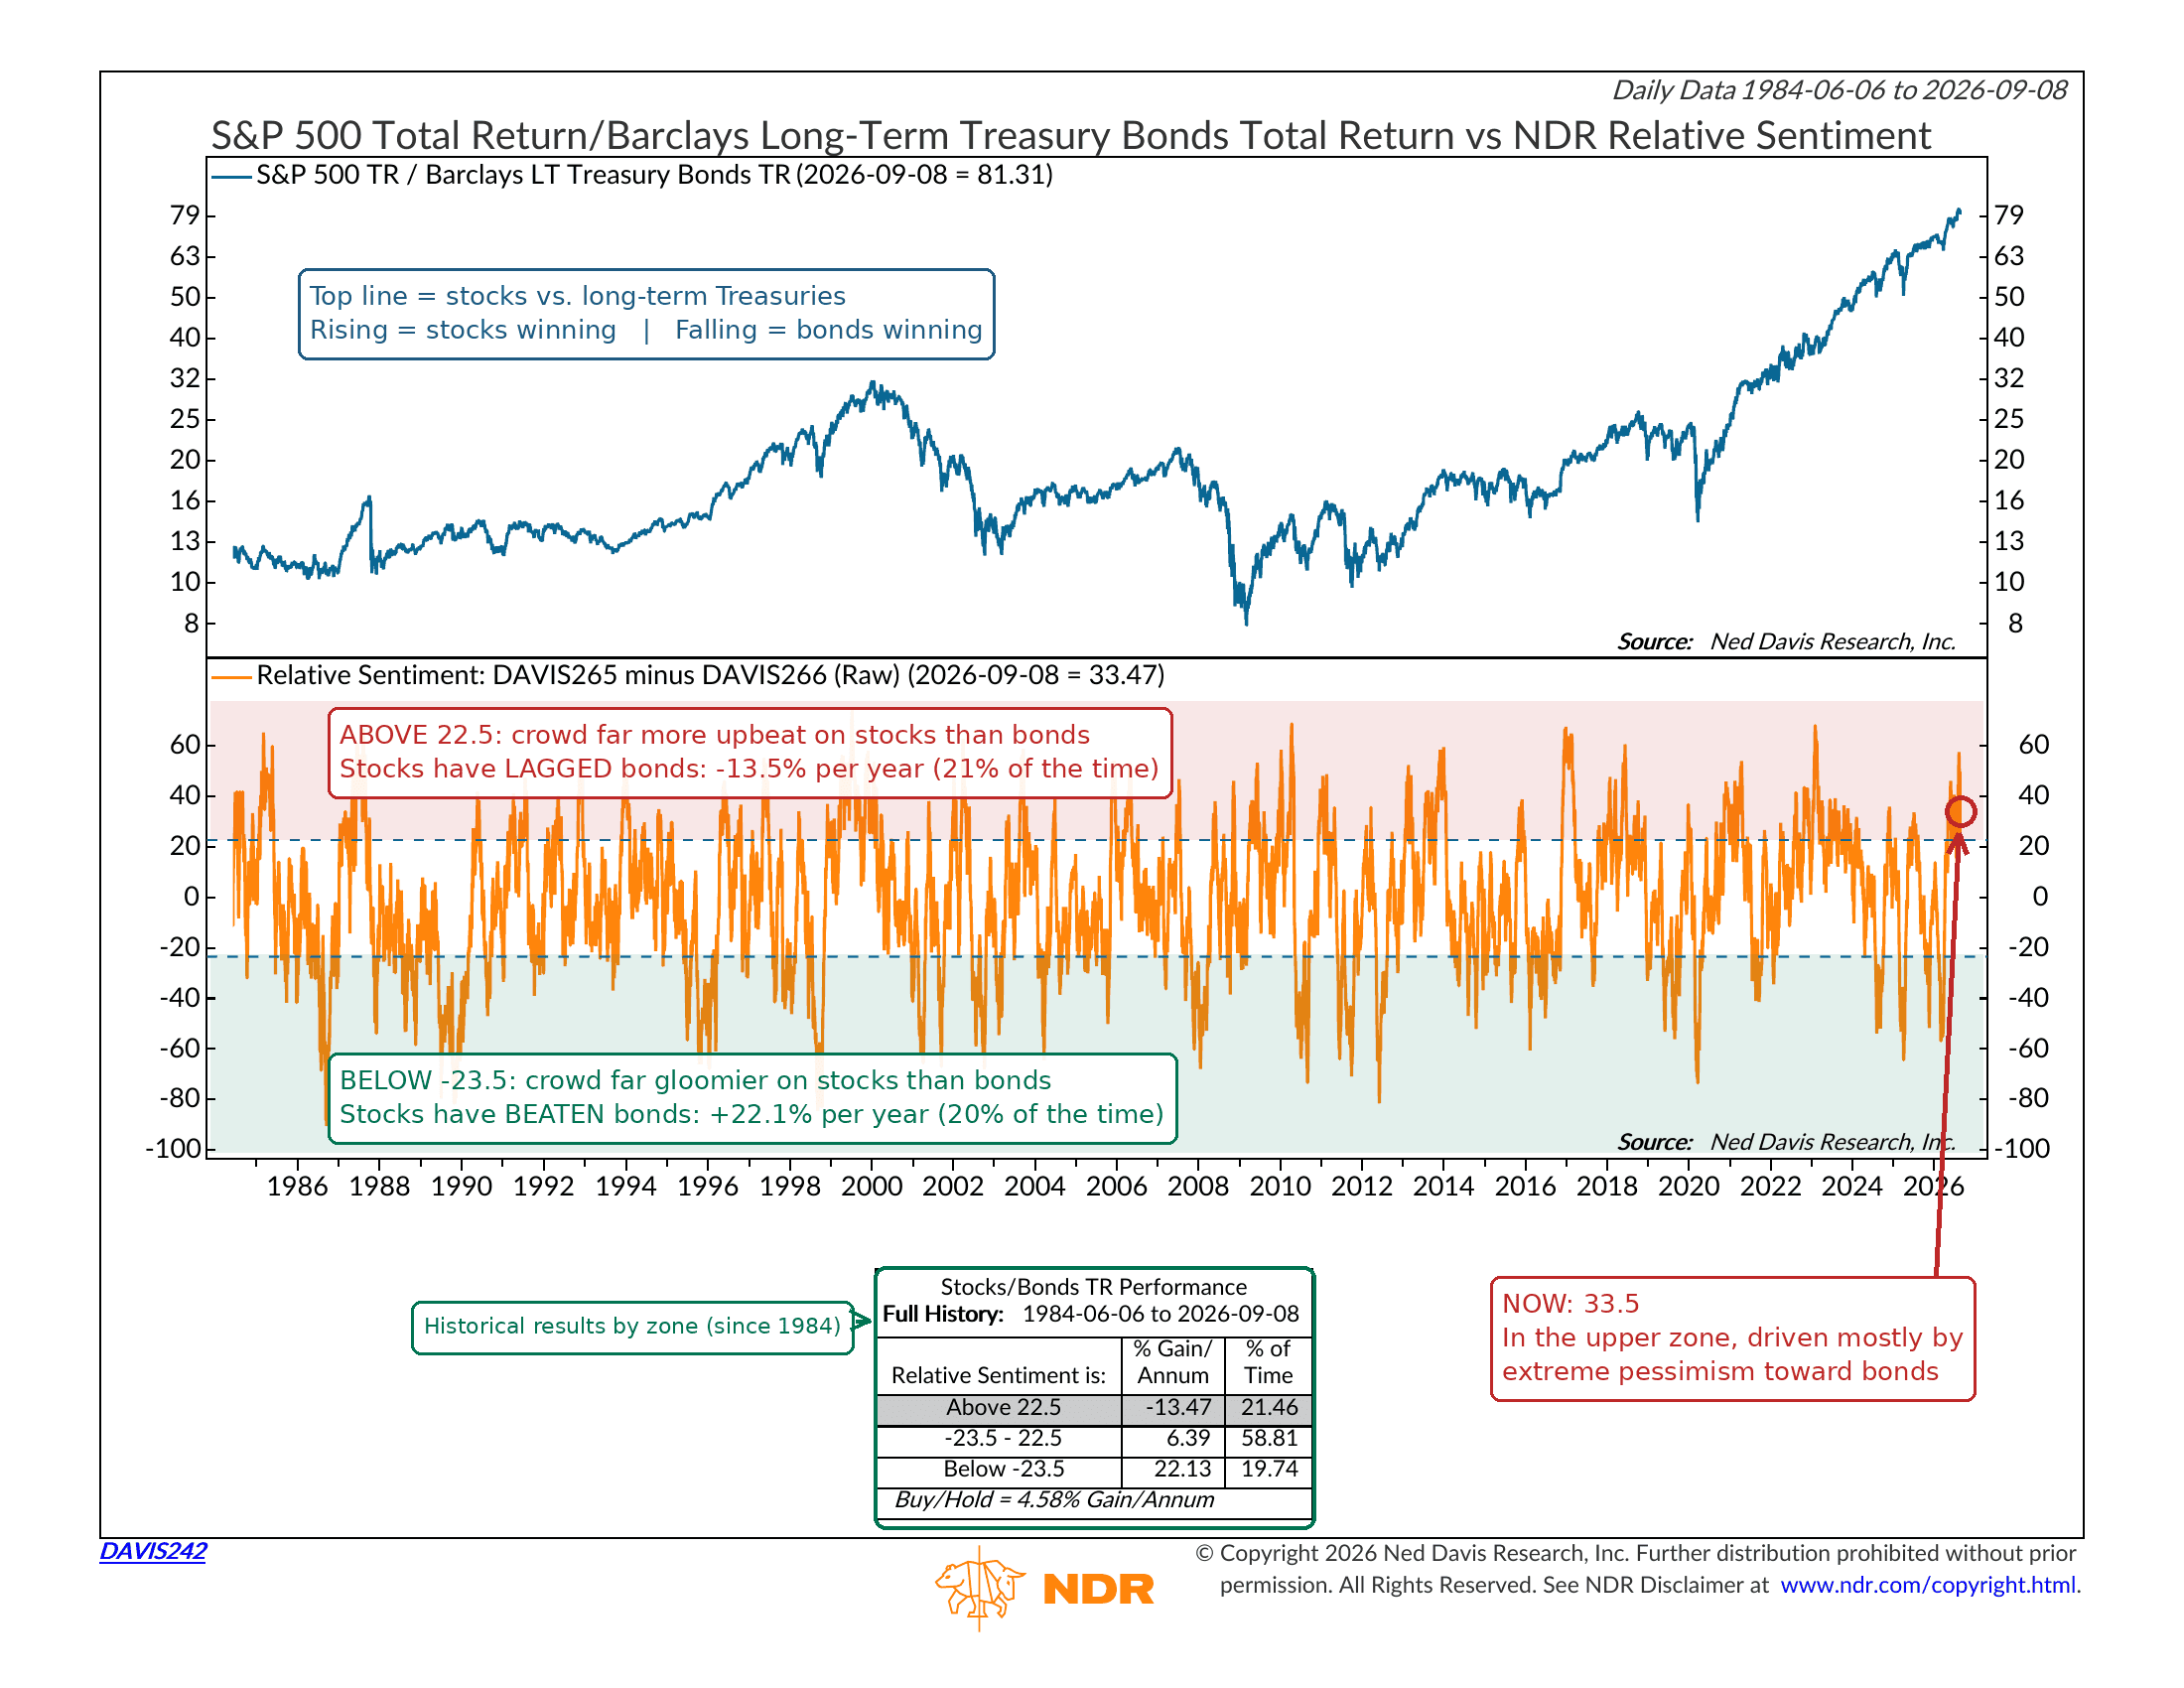
Most of the time when we talk about investor sentiment, we talk about it in terms of one market at a time. Are investors too excited about stocks? Too gloomy about bonds? This week’s indicator asks a different question: how does the mood in one market compare to the mood in the other?
Why does that matter? Well, because for most investors, the real decision isn’t “stocks or nothing.” It’s how much to own in stocks versus how much to own in bonds. And when the crowd is feeling much better about one side of that decision than the other, history says it’s worth taking the other side.
In other words, be contrarian.
Here’s how it works. The chart above tracks a daily sentiment composite for stocks and a separate one for Treasury bonds. Each combines a variety of measures—surveys, options activity, fund flows, and so on—into a single reading of how optimistic or pessimistic investors are. The indicator in the bottom section of the chart above simply takes the stock reading and subtracts the bond reading. When the line is high, investors are far more optimistic about stocks than they are about bonds. When it’s low, the reverse is true.
The top section shows the total return of the S&P 500 stock index relative to long-term Treasury bonds. When that line rises, stocks are beating bonds. When it falls, bonds are winning.
Now for the interesting part. Going back to 1984, when relative sentiment has been below -23.5—meaning investors were considerably more pessimistic about stocks than bonds—stocks went on to outperform bonds at a 22.1% annualized rate. In the neutral zone between -23.5 and 22.5, stocks outperformed by 6.4% per year. But when relative sentiment has climbed above 22.5, stocks have actually underperformed bonds at a 13.5% annualized rate.
In other words, the asset class everyone loves has tended to lag the one everyone is avoiding. That is the essence of contrarian investing, and this indicator applies it to the stock-versus-bond decision directly.
So where are we now? As of Tuesday, the indicator sat at 33.5, comfortably in the upper zone. That isn’t because investors are wildly euphoric about stocks—stock sentiment has actually cooled off recently after a modest pullback from the August highs. It’s because investors have become so downbeat on bonds. With Treasury prices under pressure most of the year and worries about inflation and Fed policy front and center, bond sentiment has been stuck in extreme pessimism since the spring and recently hit its lowest level since 2022.
Does that mean it’s time to sell stocks and load up on bonds? Not necessarily. Indicators like this one tell you about the balance of risks, not the timing. Sentiment extremes can persist, and stocks have continued to outperform even as this reading has climbed. Other pieces of the evidence, such as the trend and the economic backdrop, still favor stocks, and this indicator has been in its upper zone about a fifth of the time historically—so it’s not exactly a rare event.
But it does offer a useful reminder. When the gap between how investors feel about stocks and how they feel about bonds gets this wide, the odds start to shift toward the unloved asset. If that pessimism toward bonds begins to unwind—say, with a pause in the rise in yields—bonds could get a lift, and the stock-bond gap that has widened so dramatically over the past few years could narrow for a while.
The bottom line? Sentiment isn’t just about how investors feel about one market. It’s also about where they feel most comfortable—and, historically, the most comfortable place has rarely been the most rewarding one.
This is intended for informational purposes only and should not be used as the primary basis for an investment decision. Consult an advisor for your personal situation.
Indices mentioned are unmanaged, do not incur fees, and cannot be invested into directly.
Past performance does not guarantee future results.
The S&P 500 Index, or Standard & Poor’s 500 Index, is a market-capitalization-weighted index of 500 leading publicly traded companies in the U.S.
The Bloomberg U.S. Long Treasury Index (formerly the Barclays Long-Term Treasury Index) measures the total return of U.S. Treasury securities with remaining maturities of 10 years or more.