
The Fed went ahead and raised interest rates this week for the first time since 2023. Initially, stocks slipped to a one-month low on the news.
Of course, that got many asking the question, what happens now? We think history might offer some clues.
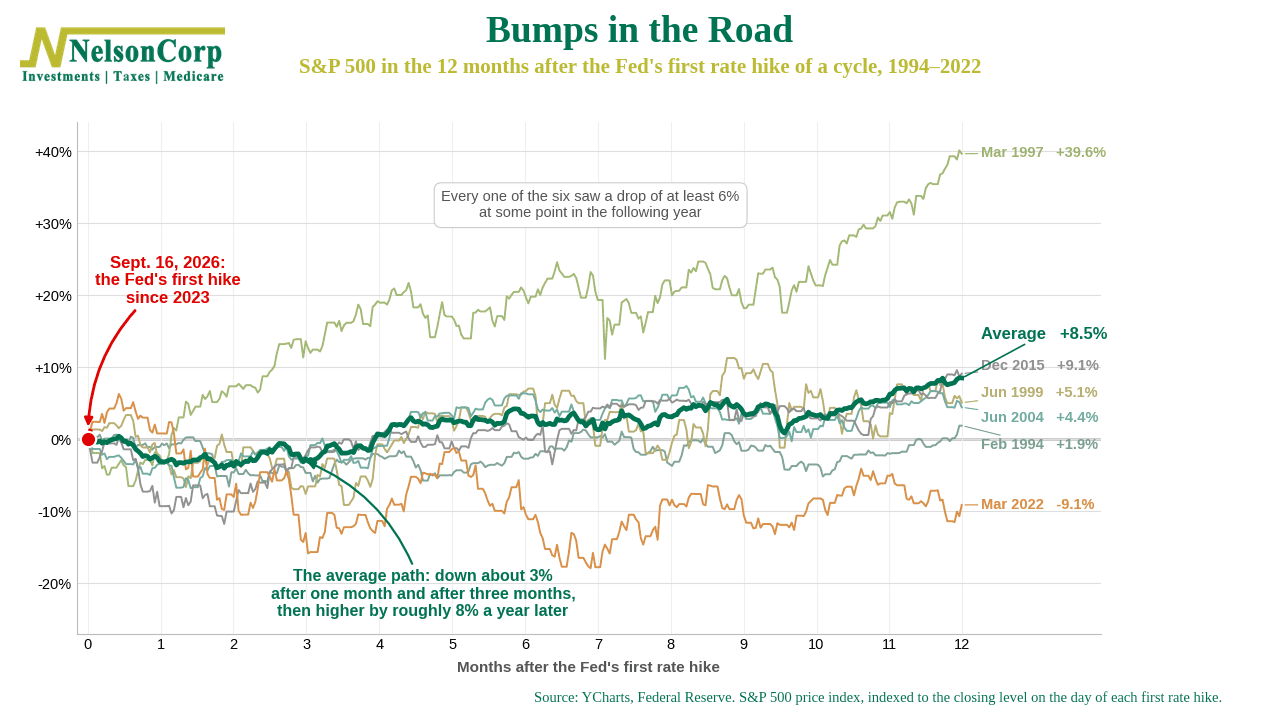
The chart above shows how the S&P 500 performed in the 12 months after the Fed’s first rate hike in each of the last six cycles, going back to 1994. Each thin line is one cycle. The thick green line is the average. The red dot is where we are today.
Two things stand out.
First, the road tends to be bumpy at the start. On average, stocks were down about 3% one month after the first hike and still down about 3% three months later. Every one of the six cycles saw a drop of at least 6% at some point in the following year. In 2022, when the Fed raised rates faster than it had in decades, stocks fell 18% before recovering some of the loss.
Second, though, the destination has usually been fine. A year after the first hike, stocks were higher in five of the six cases. The average gain was about 8.5%. The only loser was 2022.
That last point is important. The first rate hike matters, sure, but ultimately, it’s how many follow and how quickly. The Fed’s own projections call for one more increase this year. Markets are betting on a few more after that. If this turns into a fast series of hikes, 2022, unfortunately, would be the better comparison. But if it stays slow and steady, history tends to be much kinder.
The bottom line? A rate hike isn’t a reason to abandon stocks, but it is a reason to expect some turbulence. If the market gets choppy over the next few months, that would be normal. It wouldn’t necessarily mean something is broken.
This is intended for informational purposes only and should not be used as the primary basis for an investment decision. Consult an advisor for your personal situation.
Indices mentioned are unmanaged, do not incur fees, and cannot be invested into directly.
Past performance does not guarantee future results.
The S&P 500 Index, or Standard & Poor’s 500 Index, is a market-capitalization-weighted index of 500 leading publicly traded companies in the U.S.