
There’s kind of an odd thing happening in the stock market right now. A lot of the indicators we follow have weakened over the past several weeks. Breadth has thinned, interest rates and oil continue to be trouble, and sentiment isn’t exactly cooperating.
And yet, the S&P 500 stock index is sitting just below an all-time high.
When the weight of the evidence and price disagree like this, it helps to have a simple way to let the price itself settle the argument. And that is where this week’s indicator comes into play.
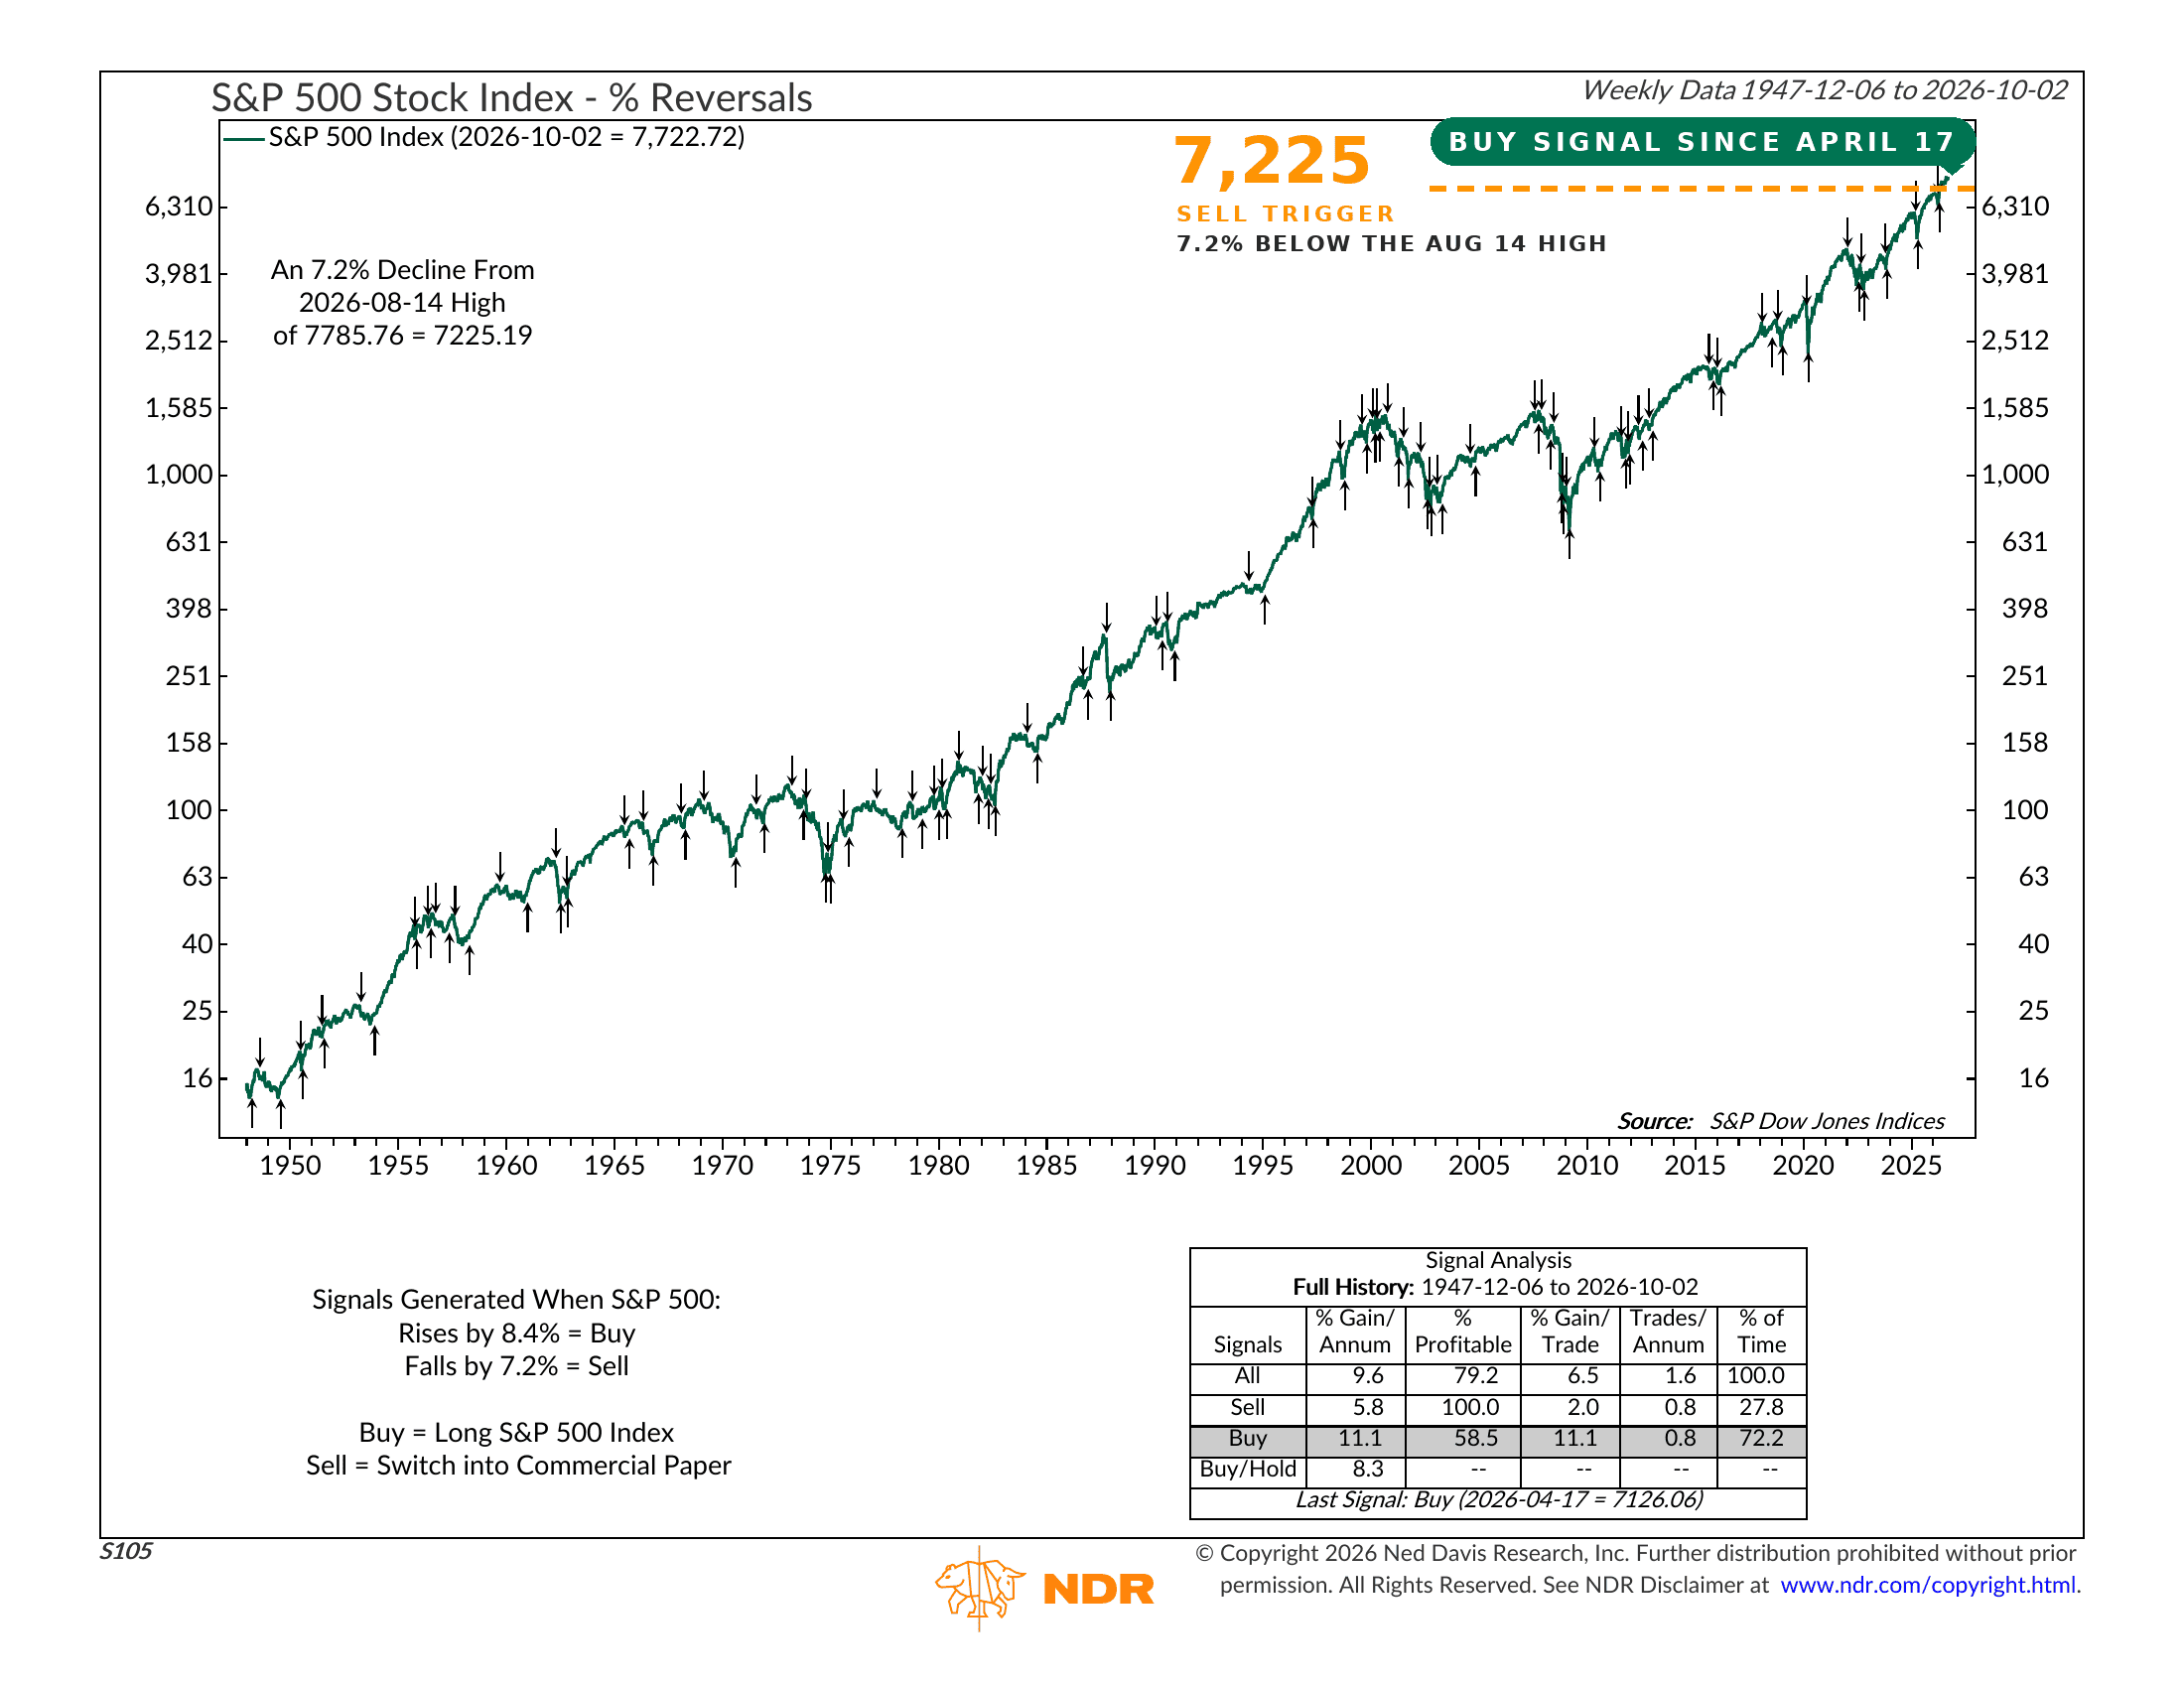
Here’s how it works. The chart above shows the S&P 500 going back to 1947 on a weekly closing basis. The rules are about as simple as they get. When the index rises 8.4% from a low, the indicator flips to a buy signal. When it falls 7.2% from a high, it flips to a sell signal. The small arrows on the chart mark every signal over the past 79 years.
That’s it. No fancy economic signals. No sentiment surveys. Nothing about valuation. It only asks one question: has the market moved far enough in the other direction to say the trend has changed?
To use the technical jargon, this is what we call a “stop-loss” indicator. It will never get you out at the top. By design, it gives up the first 7% of any decline. What it does, however, is make sure a 7% pullback doesn’t turn into a 30% bear market. In fact, every major decline since World War II has eventually tripped a signal from this indicator.
Here’s what the performance numbers look like. Since 1947, the S&P 500 has gained 11.1% per year while the indicator was on a buy signal, which has been the case about 72% of the time. During sell signals, however, the index gained just 5.8% per year. Buy-and-hold over the same stretch returned 8.3% per year. In other words, the market has done most of its heavy lifting while this indicator said the trend was up.
Ok, so where does it stand today? Well, the last signal was a buy on April 17, with the S&P 500 at 7,126. The index closed at 7,723 last Friday, so that signal has worked out well. For it to flip to a sell, the S&P 500 would need to fall 7.2% from its August 14 high of 7,786. That puts the line in the sand at about 7,225 on a weekly closing basis.
Put another way, the market would need to drop roughly 6% from here before this indicator says the uptrend is broken. Right now, therefore, it’s pretty clear that the trend remains intact.
Of course, this indicator has its flaws. It is slow by nature, and it can get whipsawed in choppy markets. A sharp 8% dip followed by a quick recovery could produce a sell signal and then a buy signal, and you would end up worse off than if you had done nothing. That has happened more than once, including a few times in the 2010s.
But honestly, that is a feature, not a bug. It’s just the nature of this type of indicator—and we know that going into it. And it’s also what makes it particularly useful right now. Many of our indicators are flashing yellow—even red—yet the one thing that hasn’t happened is a real break in the price trend. Until it does, these mixed signals call for us to have patience.
So, the bottom line? When the evidence is murky like this, we tend to let the price trend get the deciding vote. This indicator gives us a clear, objective level to watch. If the S&P 500 holds above it, the bull market gets the benefit of the doubt. If it doesn’t, the warnings we’ve been seeing elsewhere will likely have been confirmed.
This is intended for informational purposes only and should not be used as the primary basis for an investment decision. Consult an advisor for your personal situation.
Indices mentioned are unmanaged, do not incur fees, and cannot be invested into directly.
Past performance does not guarantee future results.
The S&P 500 Index, or Standard & Poor’s 500 Index, is a market-capitalization-weighted index of 500 leading publicly traded companies in the U.S.