
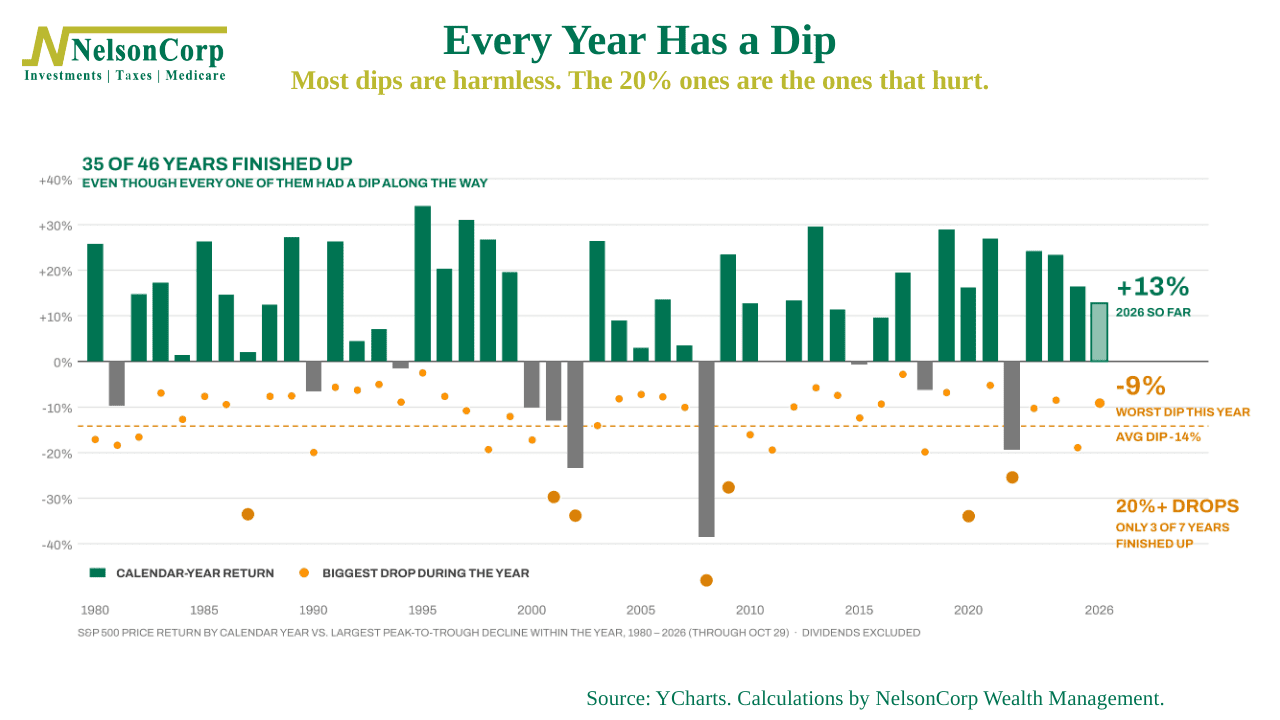
The S&P 500 stock index is down roughly 2.5% from its highs this month, nothing too scary. But under the surface, it has felt worse than that. The Nasdaq is down more than 6% from its high, and the chip stocks have dropped roughly 19% in a little over two weeks. So I thought it was a good week to pull out a chart I like.
The chart above shows every year since 1980. The green bars are how the S&P 500 finished each year. The orange dots show the biggest drop the index took at some point during that same year, from its high to its low.
Here’s the part that surprises people. The average dip is 14%. Every year has one, and 24 of the 46 years had a drop of 10% or more. Yet 35 of those 46 years still finished higher. This year fits right in. The worst drop was 9% back in the first quarter, and the index is up about 13% for the year.
But here’s the thing, look at where the big dots are. When the dip stayed under 10%, the year finished higher 21 times out of 22. No worries. But when the drop reached 20% or more, only 3 of those 7 years finished up, and the average year lost about 7%.
In other words, the ordinary dips are mostly just noise. But the big ones do real damage, and they tend to come in bunches, like 2000 through 2002, or 2008.
So here’s the catch. Nobody knows which kind of dip we’re in while it’s happening. A 9% drop that stops at 9% and a 9% drop on its way to 30% tend to feel exactly the same. So we don’t try to call it. We lean on the weight of the evidence instead. When the overall picture is healthy, a dip gets treated like a dip. When the evidence deteriorates, we get more careful, knowing that some of the time it will still turn out to be an ordinary dip after all. That’s a trade worth making. Being careful in a small dip costs a little. Riding out a big one costs a lot.
The bottom line? Dips are part of the deal, and nobody rings a bell when a small one is about to become a big one. The weight of the evidence won’t get every one right. It just has to keep the deep dots on this chart from doing their worst damage.
This is intended for informational purposes only and should not be used as the primary basis for an investment decision. Consult an advisor for your personal situation.
Indices mentioned are unmanaged, do not incur fees, and cannot be invested into directly.
Past performance does not guarantee future results.