
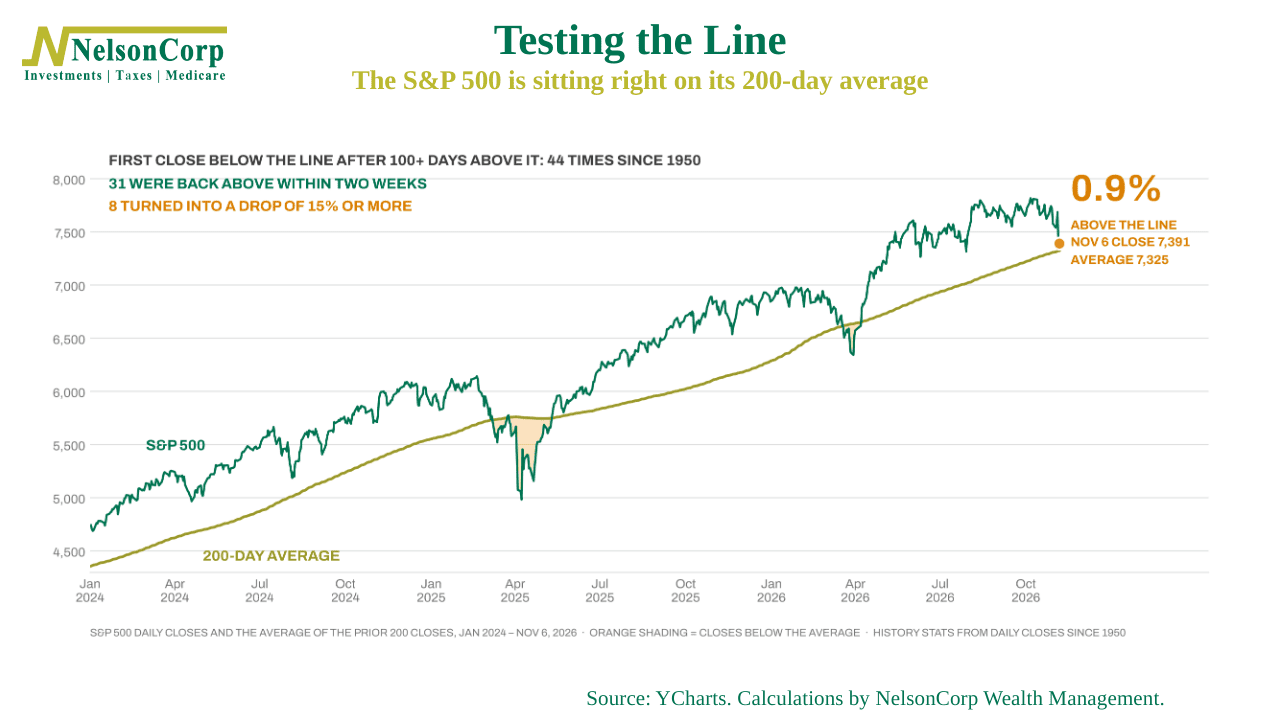
Well, that was an interesting week. The S&P 500 stock index dropped 4.4% on Thursday. And a lot of people were looking at the same thing I was on the screen: how close is the index to its 200-day moving average?
It’s a technical thing, and if you’ve never paid much attention to that line, that’s OK. But here’s the quick version. Take the last 200 trading days, roughly ten months, and average the closing prices. That’s it. When the index is above that average, the long-term trend is up and nobody thinks much about it. When it falls below, the worry starts, because that’s often where a change in trend first shows up.
Take a look at the chart above. The green line is the S&P 500 since the start of 2024, and the olive line is the 200-day average. The orange patches are the stretches when the index slipped below it, in the spring of 2025 and again back in March. As of Friday’s close, the index sits at 7,376 and the line sits at 7,325. That’s less than 1% apart. We’re right on top of it.
So what usually happens when the market breaks below? I went back to 1950 and found 44 times the index closed under the line after at least 100 straight days above it. Here’s the good news. In 31 of those cases, it was back above within two weeks, and a year later it was higher 32 times out of 43. Most of the time, a break turns out to be a head fake.
Now here’s the catch. Eight of those breaks turned into drops of 15% or more within a year, and that list includes 1987, 2007, 2020 and 2022. The line is a lousy predictor on its own, but every big drop has to come through it.
The bottom line? The market is testing its trend line, and we’ll know soon enough whether it holds. Most of these tests pass. But sometimes they don’t.
This is intended for informational purposes only and should not be used as the primary basis for an investment decision. Consult an advisor for your personal situation.
Indices mentioned are unmanaged, do not incur fees, and cannot be invested into directly.
Past performance does not guarantee future results.
The S&P 500 Index, or Standard & Poor’s 500 Index, is a market-capitalization-weighted index of 500 leading publicly traded companies in the U.S.