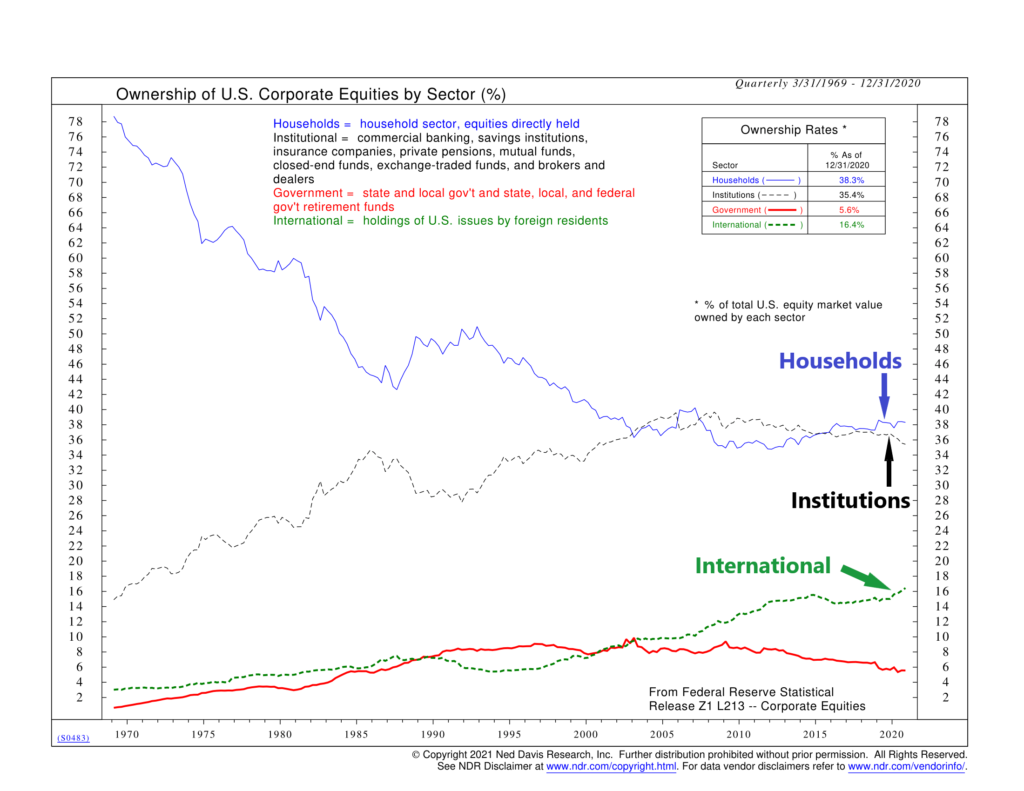
Move aside institutions; the individual investor is taking over. That’s the message from our featured chart this week, which shows the ownership of U.S. stocks broken down by sector.
Although the Federal Reserve divides the ownership of U.S. stocks into 14 sectors, this chart consolidates them into just four: households, institutions, international investors, and state and local government. It’s interesting to note that while the institutional category includes banks, insurance companies, and private pensions, it also includes mutual funds and exchange-traded funds (ETFs), even though those are many times ultimately controlled by households. Therefore, the household category is composed of just U.S. stocks held directly by individuals, not including mutual funds or ETFs.
Looking at the chart, it becomes clear that individual households (blue line) and international investors (green line) have been taking market share from institutions (black line) for many years now. This past quarter, the percentage of U.S. stocks owned by institutions fell to 35.4%, a 20-year low. By contrast, households have increased their share to 38.3%—the most of any sector—and international investors now own 16.4% of U.S stocks, a record for global ownership.
This dynamic of what I call the “little guy” taking market share from institutions reflects the optimism of the era, something we haven’t really seen since this secular bull market began. This will likely have an impact on investor sentiment going forward.
This is intended for informational purposes only and should not be used as the primary basis for an investment decision. Consult an advisor for your personal situation.
Indices mentioned are unmanaged, do not incur fees, and cannot be invested into directly.
Past performance does not guarantee future results.