This week’s indicator is a particular type of momentum indicator called a stochastic oscillator. The idea is to compare the closing price of the stock market to a range of its prices over a certain period of time.
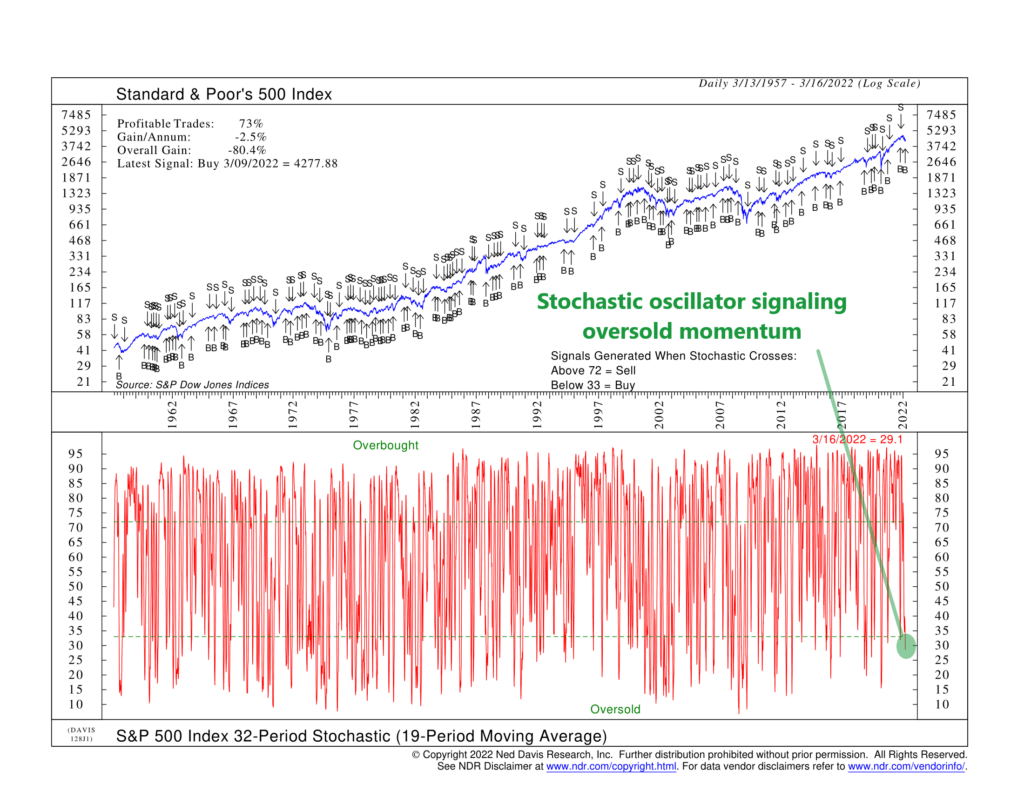
This specific indicator looks at the range of closing prices of the S&P 500 stock index over the past 32 trading days and then calculates where the current price is currently trading relative to that range. This is the red line at the bottom of the chart. (The data also gets smoothed by 19 days to make it less sensitive to short-term price jumps).
This type of calculation means that the indicator is range-bound. In other words, it will always be between 0 and 100. This makes it useful for determining when the market is overbought or oversold.
For example, the upper green dashed line on the chart represents a level of 72. When the stochastic oscillator climbs above this line, it’s a sign of an overbought market, and a sell signal is generated. However, if the stochastic oscillator falls below the lower green dashed line—representing a level of 33—it’s a sign of an oversold market. A buy signal is generated at this point.
This indicator is somewhat fast-moving, with plenty of buy/sell signals generated for the S&P 500 over the years (blue line, top of chart). Roughly 73% of the signals have resulted in a profitable trade, which is good to see.
However, the overall returns generated from the indicator make it less inspiring. This has to do with the fact that stocks tend to crash when the market is already oversold, not when they are overbought. This tendency drags down overall returns when the big market crashes come.
The good news, however, is that this is only one indicator, and it plays a specific role in the overall modeling process. When combined with other indicators, it can help the model’s overall performance. Like other indicators, its shortcomings as an individual indicator fade away when blended with different types of indicators. As the saying goes, the whole is greater than the sum of its parts.
Last week, this indicator triggered a buy signal as the stochastic oscillator fell below the lower dashed line. It appears the market is starting to look oversold relative to its recent trading range.
Perhaps this is a sign of hope. As of this writing, the S&P 500 has rallied around 1.7% since the oversold buy signal generated last week. Whether this continues, however, remains to be seen.
This is intended for informational purposes only and should not be used as the primary basis for an investment decision. Consult an advisor for your personal situation.
Indices mentioned are unmanaged, do not incur fees, and cannot be invested into directly.
Past performance does not guarantee future results.