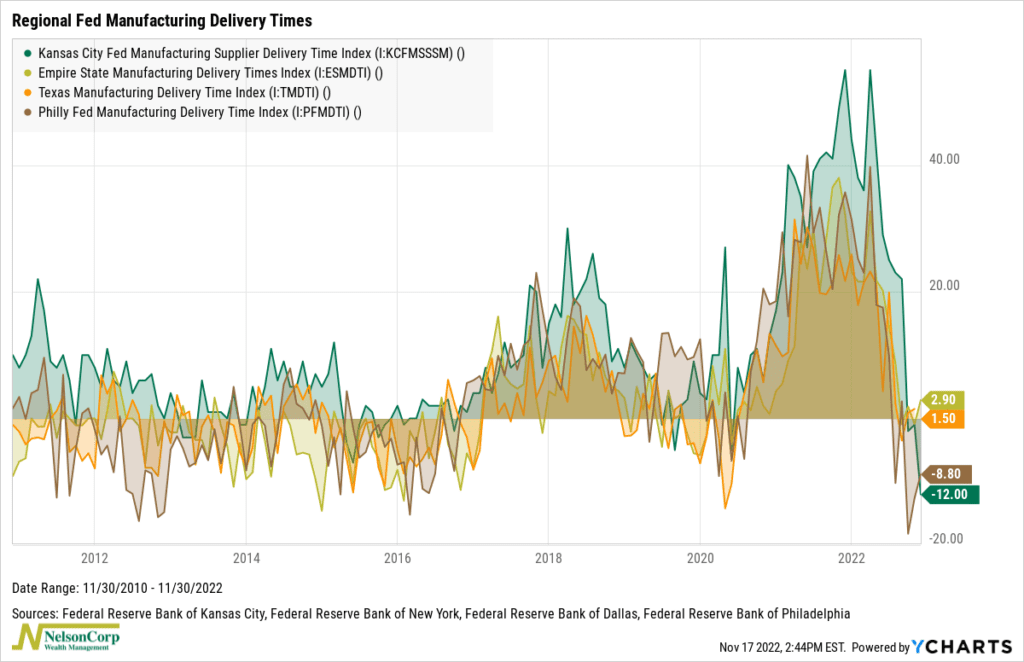
Supply chain stresses are getting better. That’s the message from this week’s featured chart, highlighted above, showing various regional Fed manufacturing indexes of supplier delivery times.
Supplier delivery times are one of the most important economic indicators to watch for in the supply chain. They represent the time between when a business places an order for stuff and when they get that stuff. Each regional Federal Reserve bank publishes its own supplier delivery time index for its region. The higher the index level, the longer it takes for businesses to get their supplies.
Longer delivery times are a relatively reliable predictor of inflation. Indeed, as you can see from the massive bump in 2021, supplier delivery times were extremely high, and inflation has been running hot.
The latest readings, however, show that delivery times have plummeted in recent months. Slowing demand has helped clear the once-stuffed transportation pipeline. In other words, the supply chain looks much better than it did a year ago.
The implication? This should help relieve the pressures on consumer price goods. As the supply chains retreat to the status quo, inflation should start to ease, albeit on a lag. However, against this backdrop, we caution that the risk of the Fed overtightening still lingers, so a defensive stance towards risk assets is still sensible.
This is intended for informational purposes only and should not be used as the primary basis for an investment decision. Consult an advisor for your personal situation.
Indices mentioned are unmanaged, do not incur fees, and cannot be invested into directly.
Past performance does not guarantee future results.