by NelsonCorp Wealth Management | Nov 12, 2021 | Chart of the Week
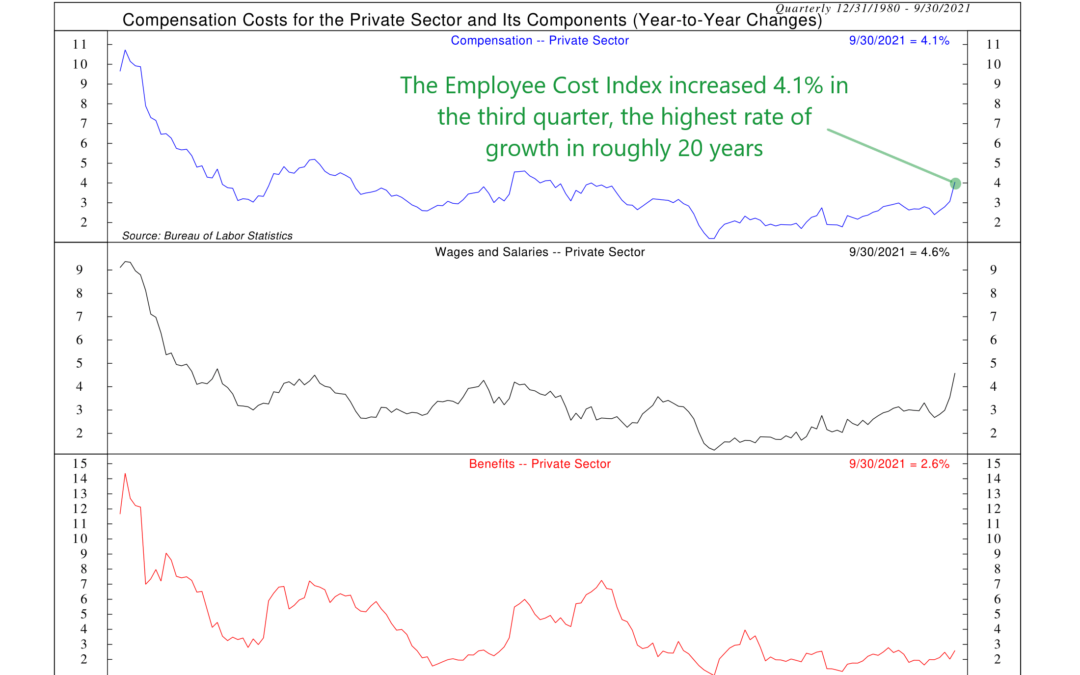
Above target inflation and widespread supply and labor shortages are things the U.S. economy hasn’t experienced in quite some time. The good news for workers, however, is that companies have raised wages at an exceptional rate in recent months, hoping to...
by NelsonCorp Wealth Management | Oct 29, 2021 | Chart of the Week
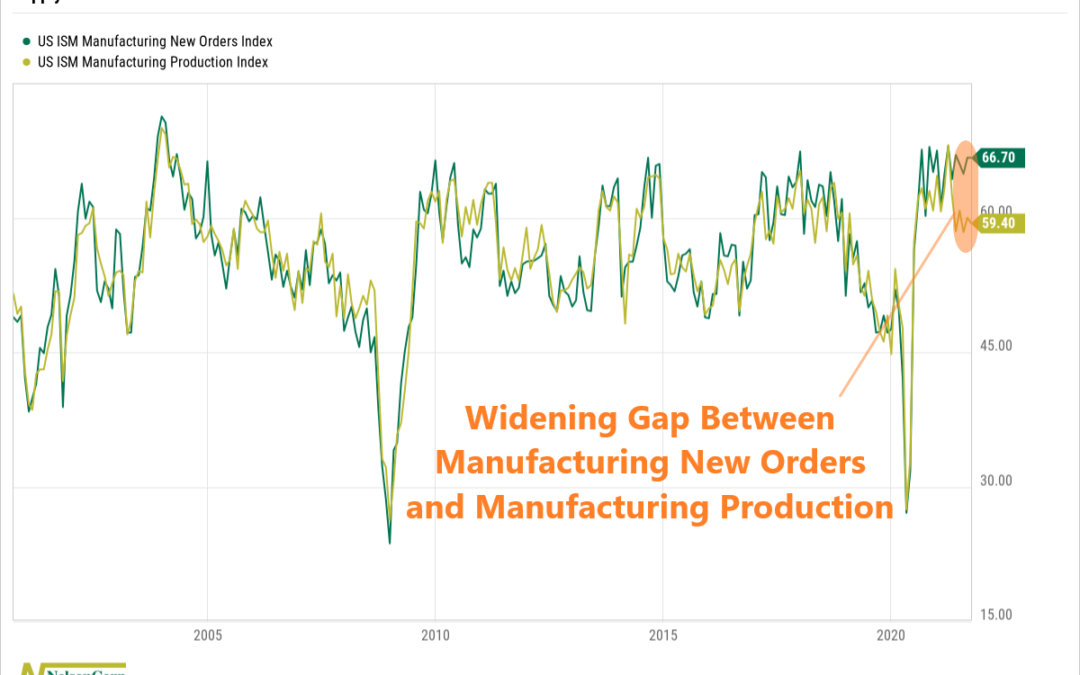
This week’s featured chart reveals a widening gap between the U.S. ISM Manufacturing New Orders Index, which is rising, and the Production Index, which is falling. Historically, these two series have tracked each other closely, a sign that supply and demand are...
by NelsonCorp Wealth Management | Oct 22, 2021 | Chart of the Week
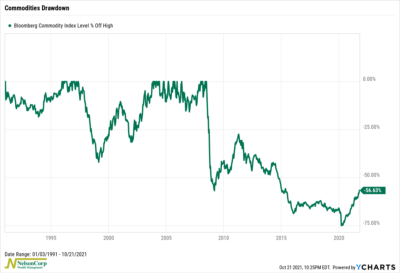
This week we look at a chart of the Bloomberg Commodity Index, a benchmark index that tracks the performance of the entire commodity market. The index itself is broken down into six major commodity groups: energy, grains, industrial metals, precious metals,...
by NelsonCorp Wealth Management | Oct 15, 2021 | Chart of the Week
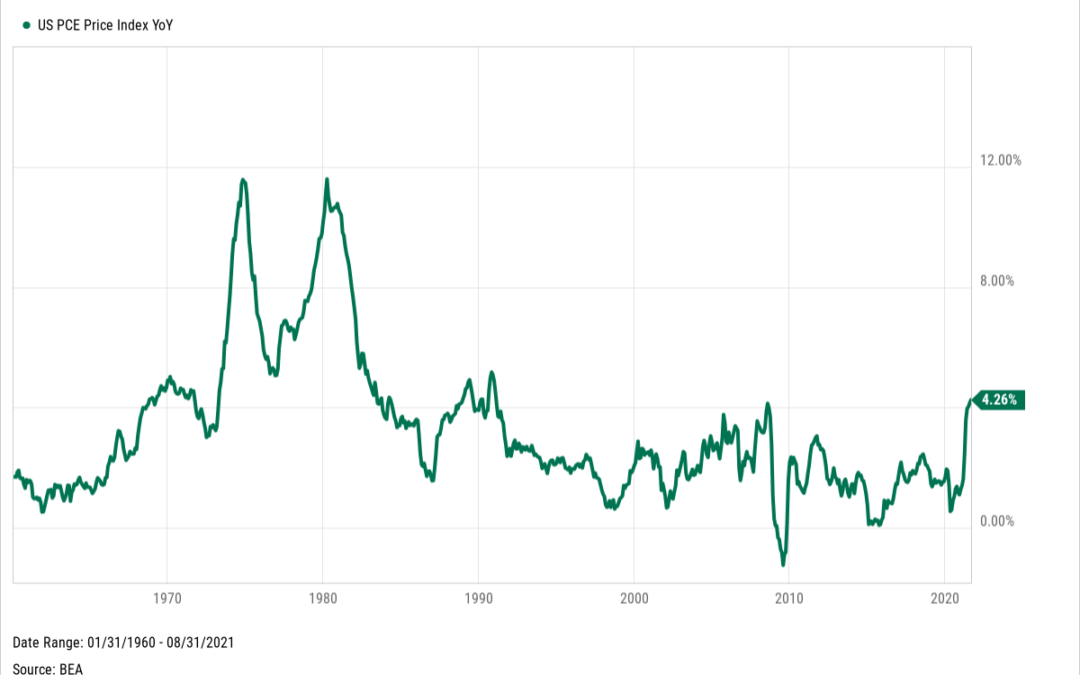
Inflation. It’s been a big topic of discussion this year because it’s been rising at a pace that we haven’t seen in this country in 30 years, as shown in our chart above. This chart shows the U.S. Personal Consumption Expenditures (PCE) Index. It measures...
by NelsonCorp Wealth Management | Oct 8, 2021 | Chart of the Week
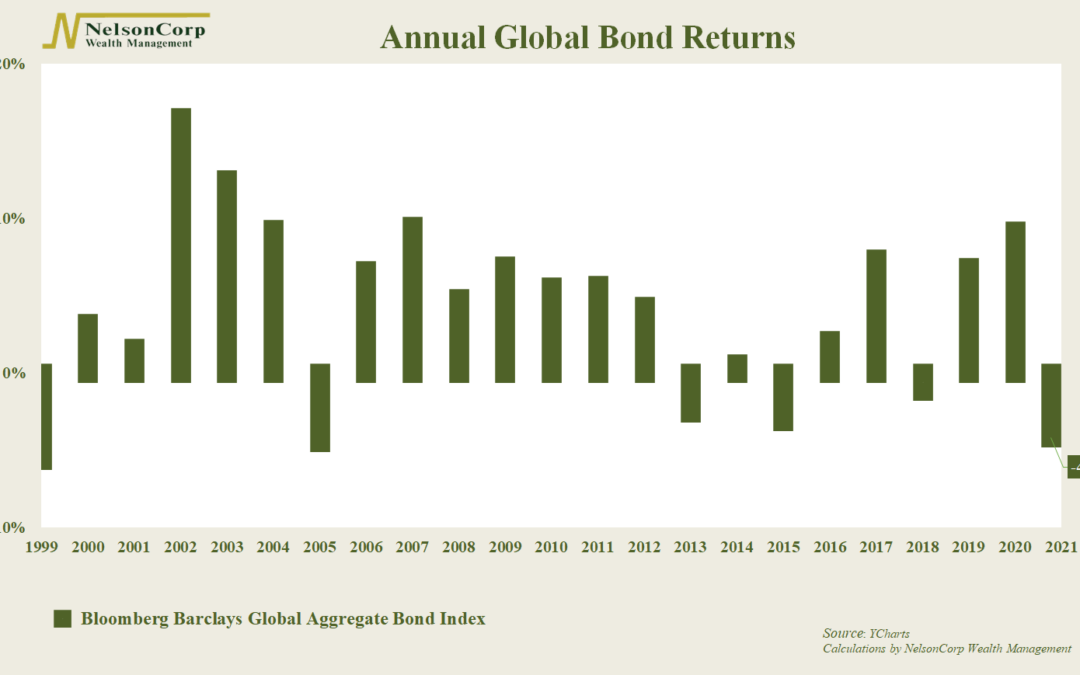
Bonds have really struggled this year. Globally, they are down about 4.2%, as represented by the Bloomberg Barclays Global Aggregate Bond Index shown in the chart above. The index is on track for its worst annual return in roughly two decades, and it’s well...
by NelsonCorp Wealth Management | Oct 1, 2021 | Chart of the Week
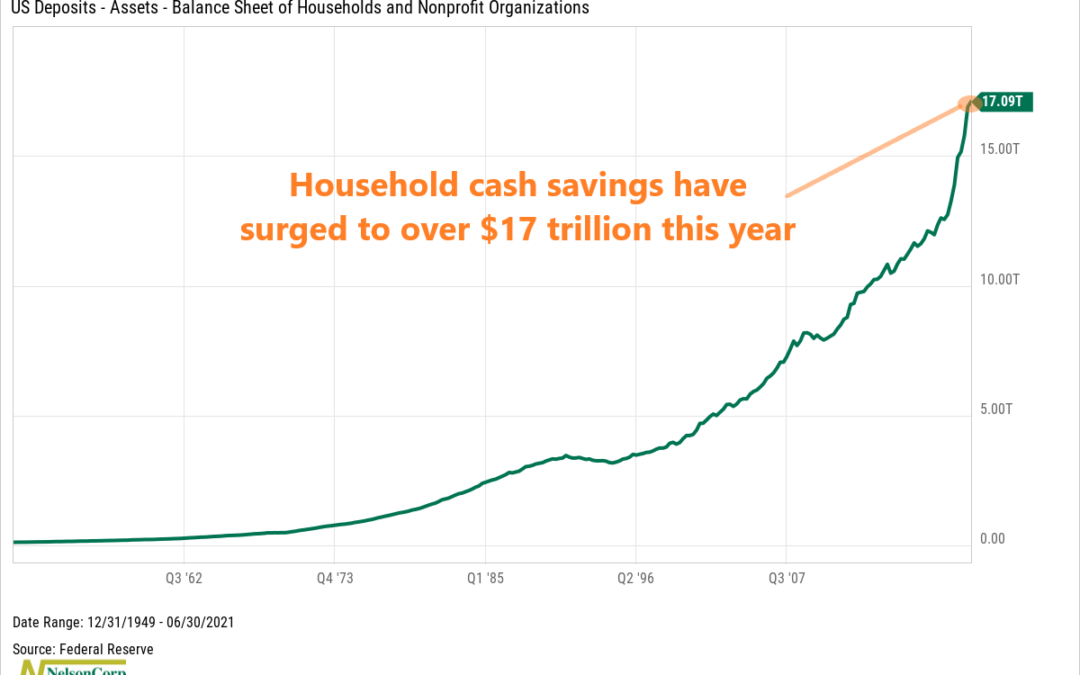
Americans have seen their net worths surge over the past year and a half, thanks largely to gains in stock prices and swelling home values. However, they also have an incredible amount of cash lying around too. Last Thursday, the Federal Reserve reported that...
