
by NelsonCorp Wealth Management | May 25, 2023 | Indicator Insights
For this week’s indicator, we’re going to take a look at stock market earnings and how they can be used to forecast stock market returns. In the top part of the chart above, we have plotted the S&P 500 Index’s monthly close (green line), which we’ll be...

by NelsonCorp Wealth Management | May 18, 2023 | Indicator Insights
There’s this amusing scene in the 2000 movie Boiler Room where Ben Affleck’s character boasts about his wealth to a room full of interns. He proudly mentions his luxurious car, beautiful house, and most importantly, he says, “I am liquid.” By...
by NelsonCorp Wealth Management | May 11, 2023 | Indicator Insights
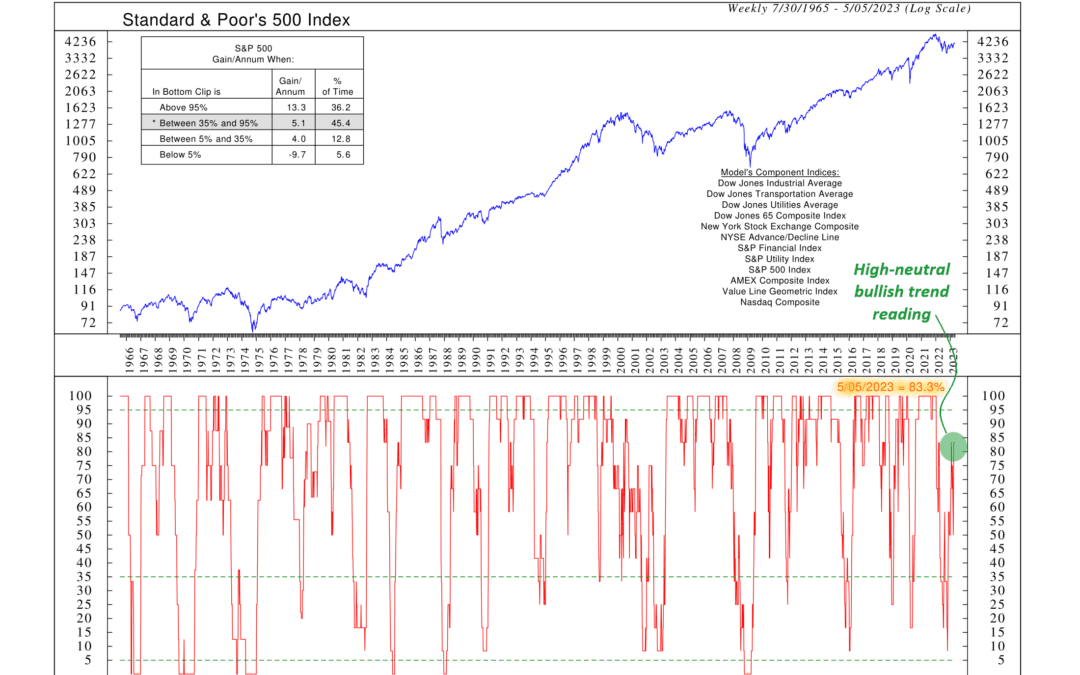
A lot of investing success comes from being able to stay on the right side of a trending market. This principle is encapsulated by the industry phrase “Keep the trend your friend.” In other words, it’s not a good idea to fight your friend, and it’s...

by NelsonCorp Wealth Management | May 4, 2023 | Indicator Insights
Investors have long been searching for ways to forecast stock returns. But with so much data available, it can be overwhelming. An easy solution is to simplify the process. One approach that has proved particularly useful over the years is the use of moving...

by NelsonCorp Wealth Management | Apr 27, 2023 | Indicator Insights
Now that inflation is on the decline, investors are increasingly focusing on stock market earnings. So for this week’s indicator, we will look at both inflation and corporate earnings in the form of the real earnings yield. What is the real earnings yield?...

by NelsonCorp Wealth Management | Apr 20, 2023 | Indicator Insights
Margin debt is the topic of this week’s indicator. What is margin debt? It’s simply money borrowed from a broker for the purpose of buying stock. Typically, you see it used by speculators who wish to leverage their stock purchases, making it a great gauge of...
