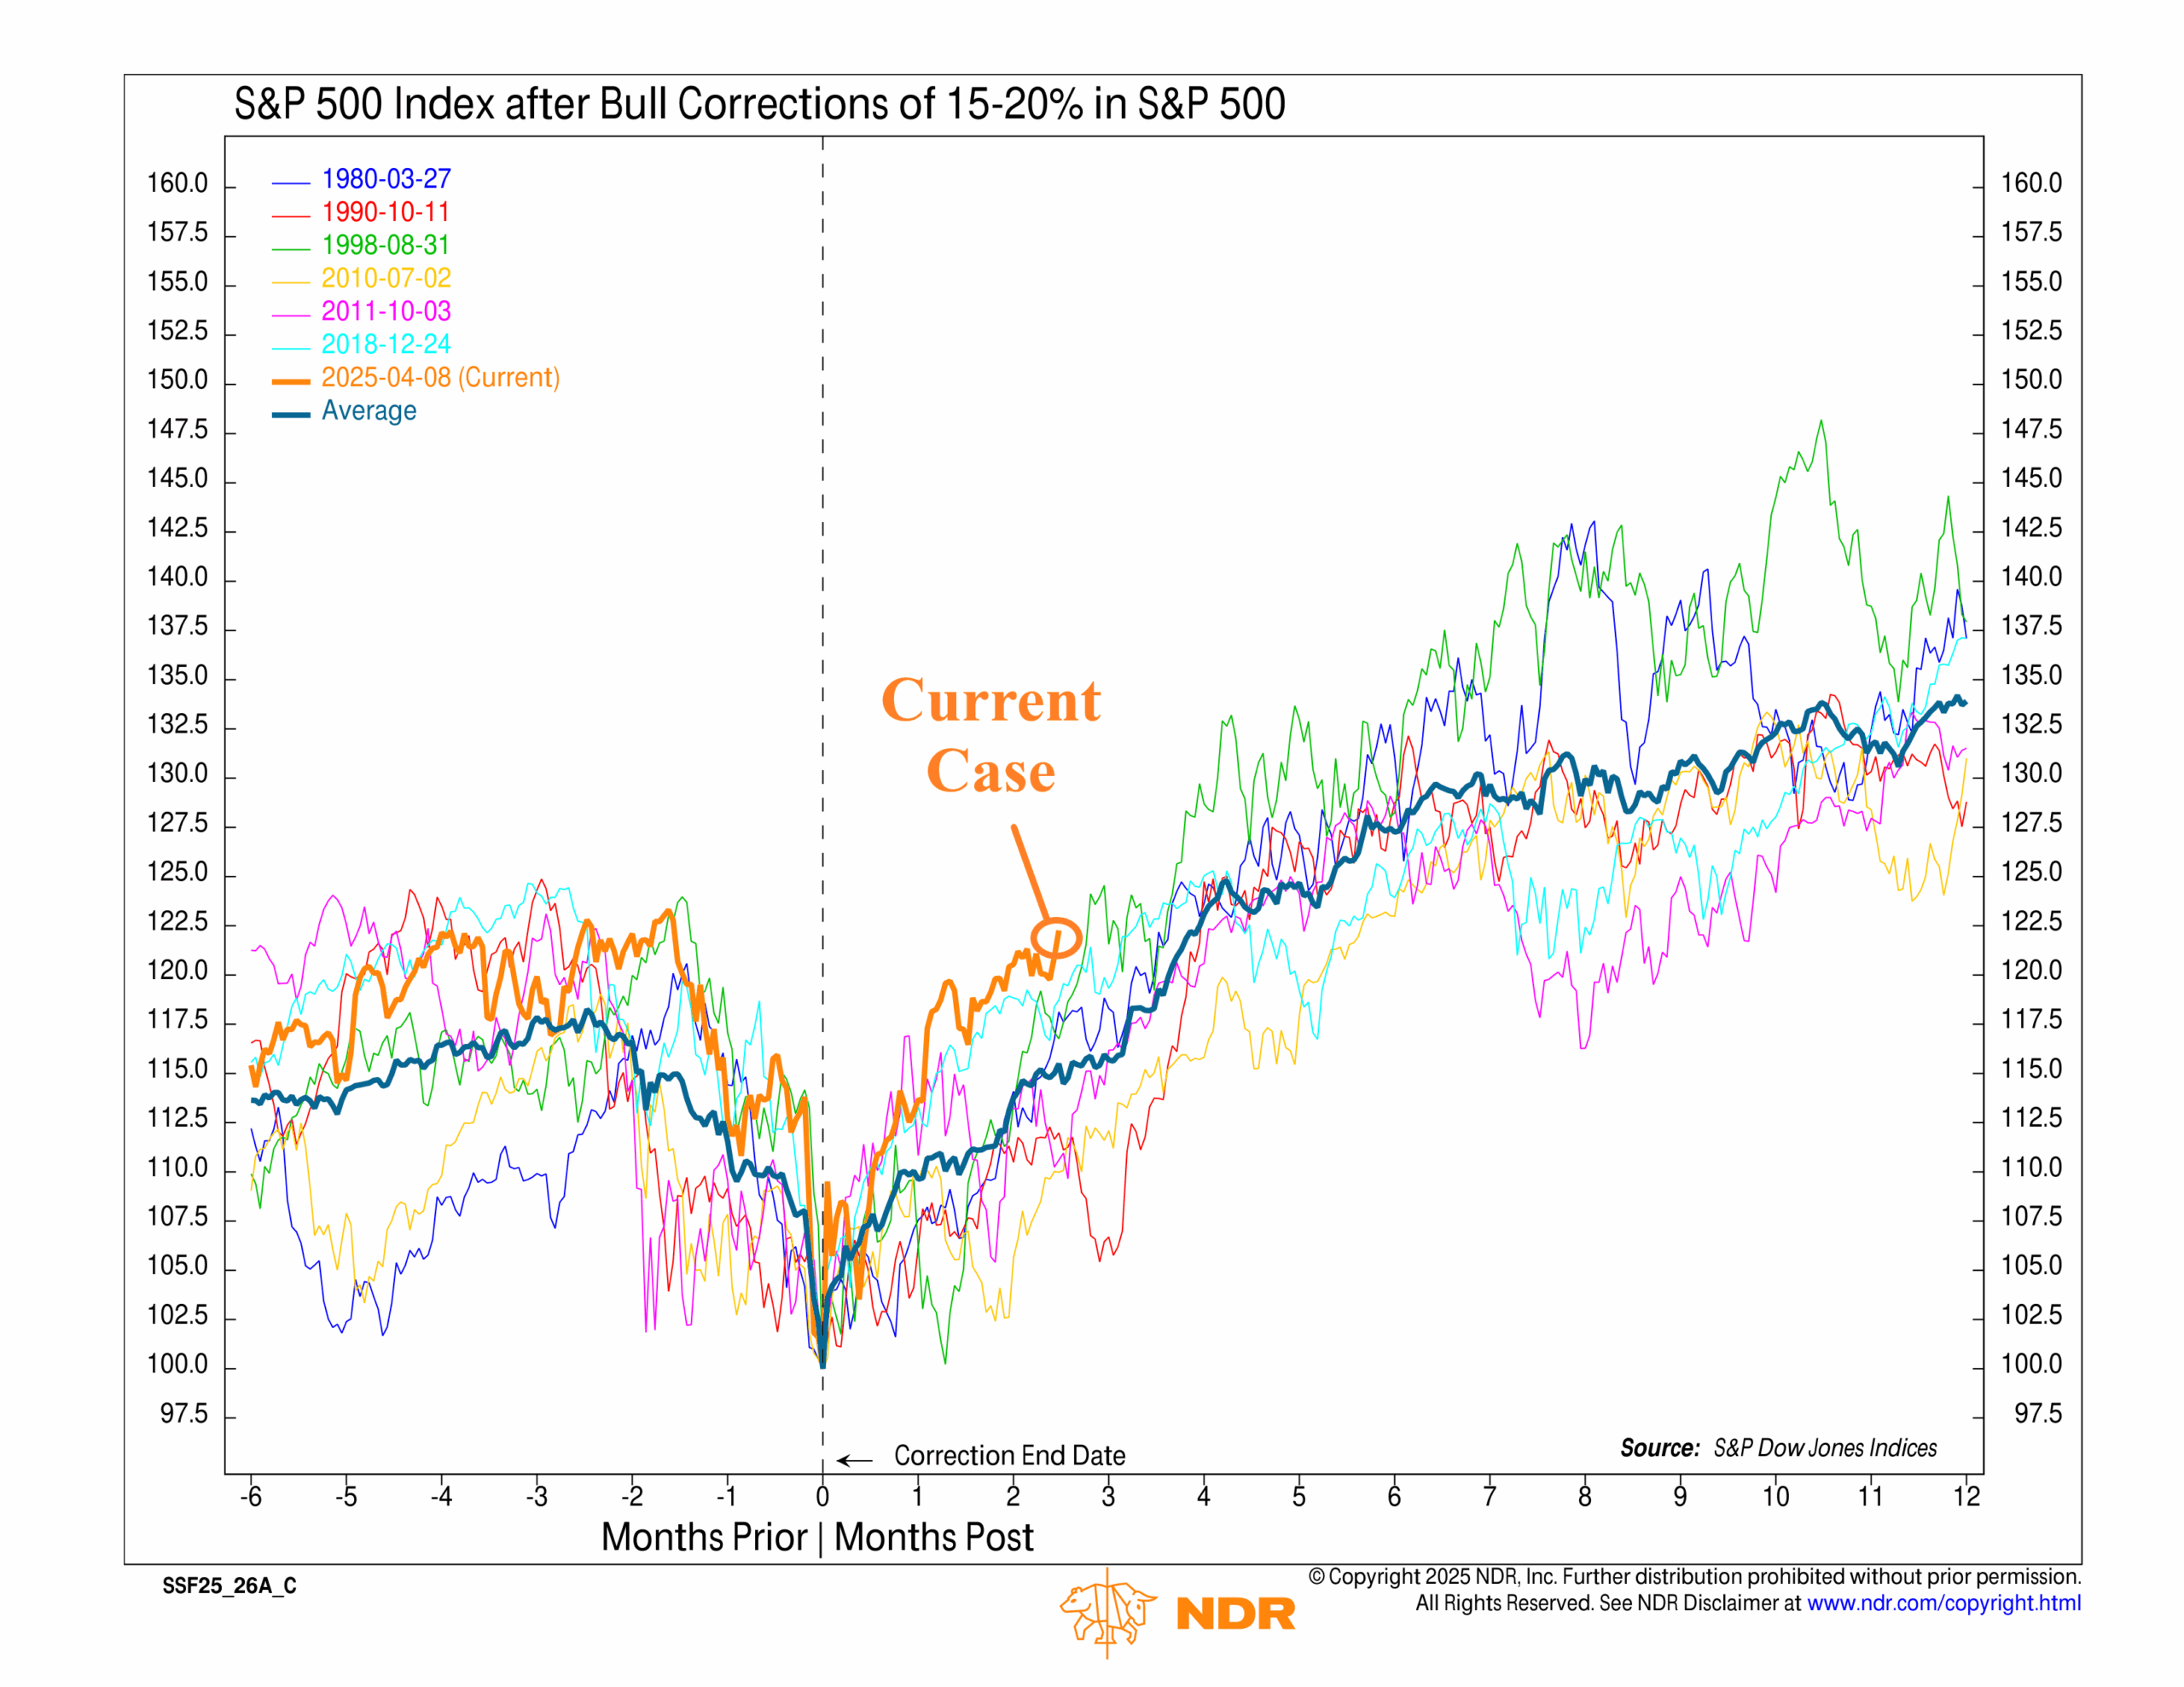
It’s been a quick recovery for U.S. stocks since the April downturn. This week’s chart shows just how quick.
First, a recap. The S&P 500 dropped 18.9% on a closing basis through April. While steep, it didn’t quite hit the 20% threshold that defines a bear market, so we classify it as a correction. This week’s chart looks at six other historical cases where the S&P fell between 15% and 20%—also corrections—and compares their recoveries to what we’re seeing now.
The takeaway? The rebound over the past 2.5 months has been impressive. The S&P 500 jumped 22.3% from April 8 through June 24, making it the strongest of the seven cases. Only the 1980 and 2018 corrections came close, and even they trailed at this stage. The orange line highlights today’s rally pulling ahead of the others, including the historical average shown in blue.
In other words, the recent rebound in stocks has been quite extraordinary—much stronger than prior historical cases. It reflects strong momentum, improving sentiment, and investors stepping back in—all of which points to a healthy backdrop for the current bull market.
This is intended for informational purposes only and should not be used as the primary basis for an investment decision. Consult an advisor for your personal situation.
Indices mentioned are unmanaged, do not incur fees, and cannot be invested into directly.
Past performance does not guarantee future results.
The S&P 500 Index, or Standard & Poor’s 500 Index, is a market-capitalization-weighted index of 500 leading publicly traded companies in the U.S.