Most people have an instinct that buying stocks at all-time highs is a bad idea. Sure, I get it. It kind of feels like showing up late to the party. But as this week’s chart shows, you probably don’t need to be afraid.
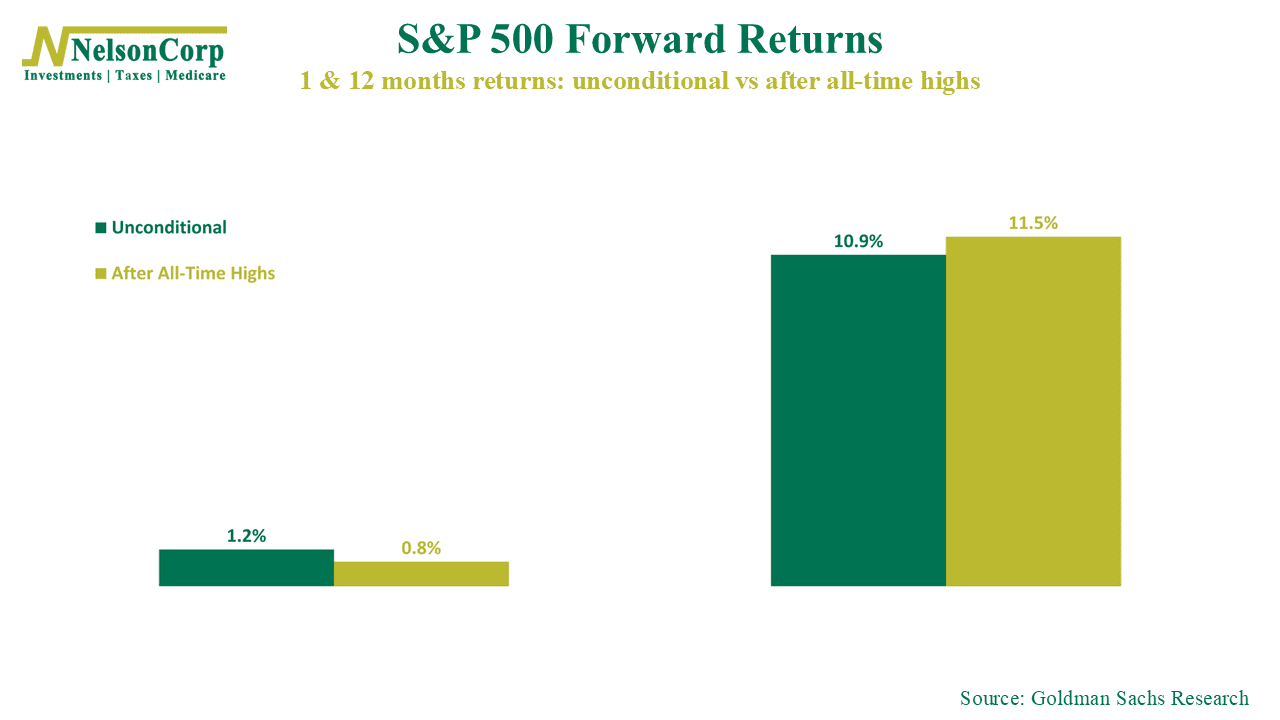
The chart comes from Goldman Sachs Research and looks at S&P 500 returns under two conditions: on any given day (the “unconditional” baseline), and specifically after the market hits a new all-time high. The short-term picture does give you a little pause—one month after an all-time high, returns average just +0.8%, slightly below the unconditional average of +1.2%. So yeah, the nerves aren’t completely unfounded.
But zoom out to 12 months, and the picture flips entirely. After all-time highs, the S&P 500 has historically returned +11.5% over the next year, which is actually better than the unconditional average of +10.9%.
In other words, new highs tend to beget more new highs.
Why? Because the market doesn’t usually hit record territory on accident. It tends to happen when earnings are growing, the economy is healthy, and investors have legitimate reasons to be optimistic—which is pretty much where we are right now.
The bottom line? Yes, the S&P 500 is at an all-time high, and things might be a little choppy in the short term. But if history is any guide, the fear of heights is usually more dangerous than the heights themselves.
This is intended for informational purposes only and should not be used as the primary basis for an investment decision. Consult an advisor for your personal situation.
Indices mentioned are unmanaged, do not incur fees, and cannot be invested into directly.
Past performance does not guarantee future results.
The S&P 500 Index, or Standard & Poor’s 500 Index, is a market-capitalization-weighted index of 500 leading publicly traded companies in the U.S.