
For this week’s chart, we’re looking at a topic that tends to fly under the radar of many investors: correlation.
What is correlation? Simply put, it measures how closely two things move together. In the stock market, high correlation means stocks are generally moving in the same direction at the same time, while low correlation means they are behaving more independently.
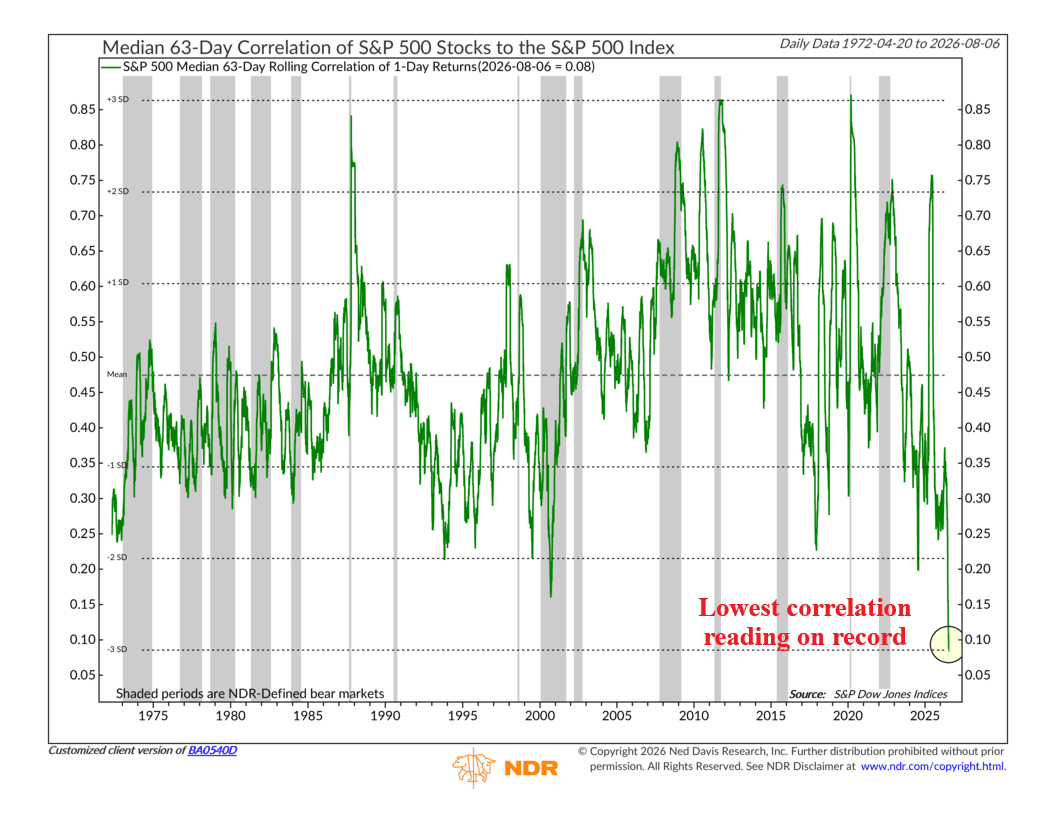
The green line on the chart measures the median 63-day correlation of individual S&P 500 stocks to the index itself. When that line rises, the average stock is moving more closely with the broader market. When it falls, individual stocks are increasingly marching to their own beat.
Why does that matter?
Well, historically, we have generally viewed rising correlations as a warning sign for stocks. During periods of market stress, investors tend to focus less on individual companies and more on risks facing the market as a whole. That can cause stocks to move together, particularly on the downside. You can see several examples of correlations jumping around the shaded bear-market periods on the chart.
In other words, it’s like the market throwing the baby out with the bathwater.
Lower correlation, on the other hand, tends to be a healthier sign. It suggests company-specific factors are playing a larger role in determining which stocks rise and fall, rather than one broad force driving the entire market.
Which brings us to today. The median correlation has fallen to just 0.08, the lowest reading on record going back to 1972. It is also more than three standard deviations below its long-term average.
Now normally we would view low correlation as a positive. But at this point, there simply isn’t much room left to go lower. With correlation at its lowest level in more than 50 years, the next major move is much more likely to be higher than lower.
That does not mean stocks are about to fall or that correlation has to reverse immediately. Extremes can remain extreme for some time. But because rising correlation has historically been a less favorable development for stocks, it does make us somewhat cautious
Bottom line: Low correlation remains a positive for stocks, but we are now at the lowest level on record. With much more room to rise than fall from here, a reversal in correlation could become an important warning sign for the market.
This is intended for informational purposes only and should not be used as the primary basis for an investment decision. Consult an advisor for your personal situation.
Indices mentioned are unmanaged, do not incur fees, and cannot be invested into directly.
Past performance does not guarantee future results.
The S&P 500 Index, or Standard & Poor’s 500 Index, is a market-capitalization-weighted index of 500 leading publicly traded companies in the U.S.