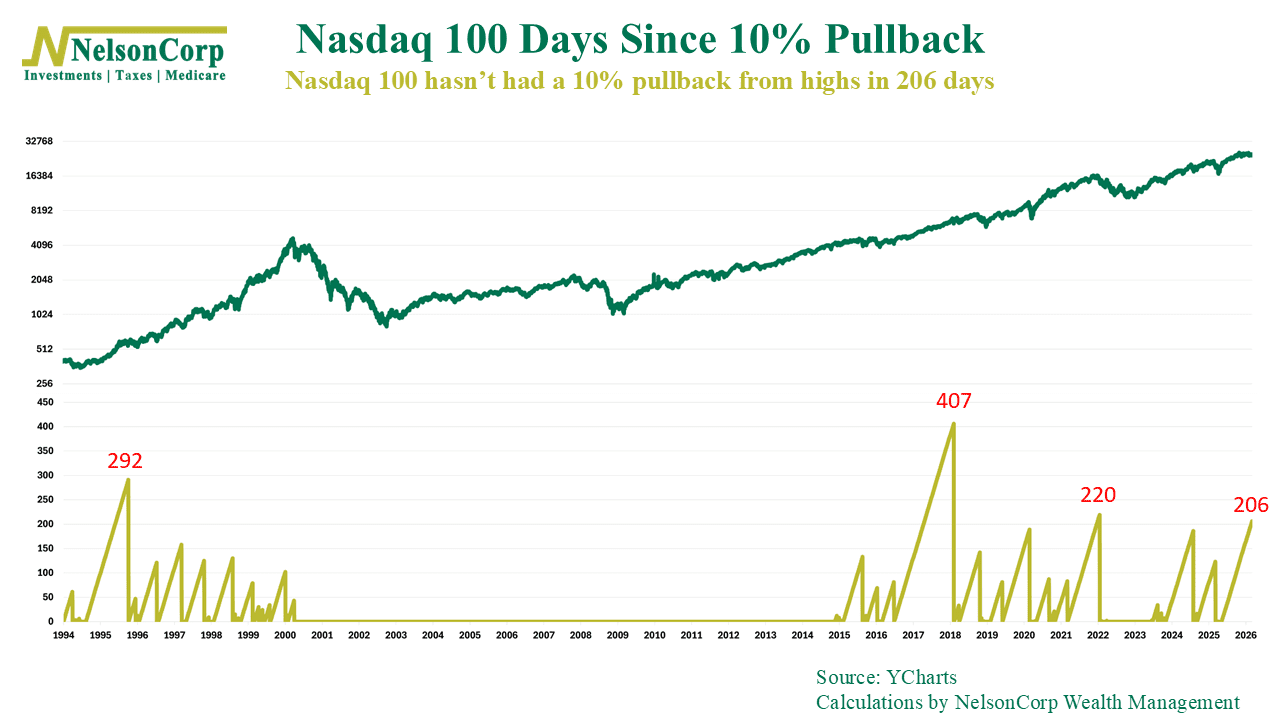
It’s been a while since we’ve seen a meaningful pullback in the stock market. Specifically, our chart above shows that it’s been 206 days since the last time the Nasdaq-100—the tech-heavy U.S. stock index—declined more than 10% from a high, the fourth longest streak since 1994.
This is a good chart for investors to remember just how volatile the stock market is. Drawdowns of 10% or more happen more frequently than you might think, especially with an index that is so heavily titled to growth-oriented, volatile tech stocks, like the Nasdaq-100 Index.
The markets in general have been a bit testy in recent weeks. But the latest downturns have mostly been about the ongoing military action in the Middle East—and the surge in the price of oil.
From a fundamentals standpoint, though, not much has changed. Corporate earnings expectations remain largely intact. So while the market could certainly keep grinding higher, history suggests that a 10% pullback at some point would not be unusual. In fact, after such a long stretch without one, a reset in prices would likely be a fairly normal pause in what has otherwise been a resilient market.
This is intended for informational purposes only and should not be used as the primary basis for an investment decision. Consult an advisor for your personal situation.
Indices mentioned are unmanaged, do not incur fees, and cannot be invested into directly.
Past performance does not guarantee future results.
The Nasdaq 100 Index is a basket of the 100 largest, most actively traded U.S. companies listed on the Nasdaq stock exchange. The index includes companies from various industries except for the financial industry, like commercial and investment banks.