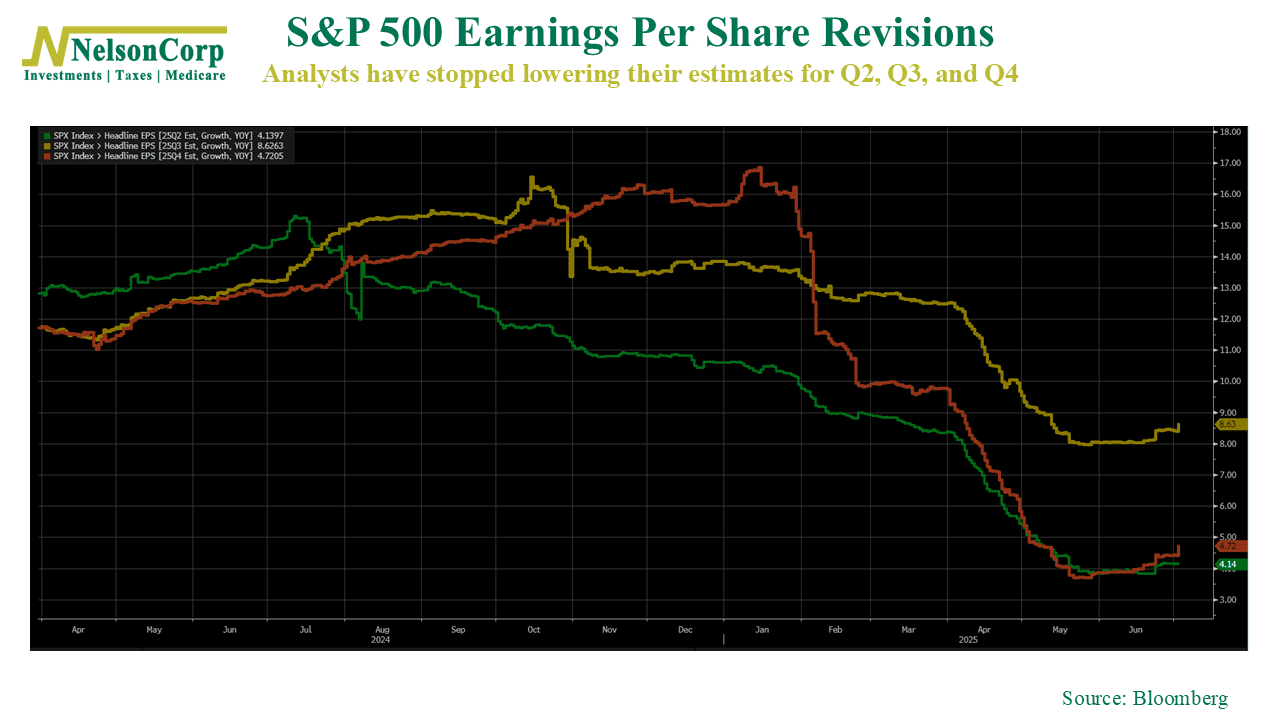
We’ve gotten some encouraging news on the earnings front lately. As this week’s chart shows, after months of steady cuts, analysts have finally stopped lowering their S&P 500 earnings estimates.
Each line in the chart tracks the year-over-year growth forecast for earnings in Q2, Q3, and Q4. You can see how sharply expectations were lowered earlier this year — especially as headlines around tariffs rattled the market.
But now, things seem to have leveled off. That likely means expectations have reset to more reasonable levels, which can be a healthier foundation for future returns. In fact, we’ve even seen a small bump in earnings forecasts recently.
The bottom line? For now, the bleeding has stopped — and that’s a step in the right direction.
This is intended for informational purposes only and should not be used as the primary basis for an investment decision. Consult an advisor for your personal situation.
Indices mentioned are unmanaged, do not incur fees, and cannot be invested into directly.
Past performance does not guarantee future results.
The S&P 500 Index, or Standard & Poor’s 500 Index, is a market-capitalization-weighted index of 500 leading publicly traded companies in the U.S.