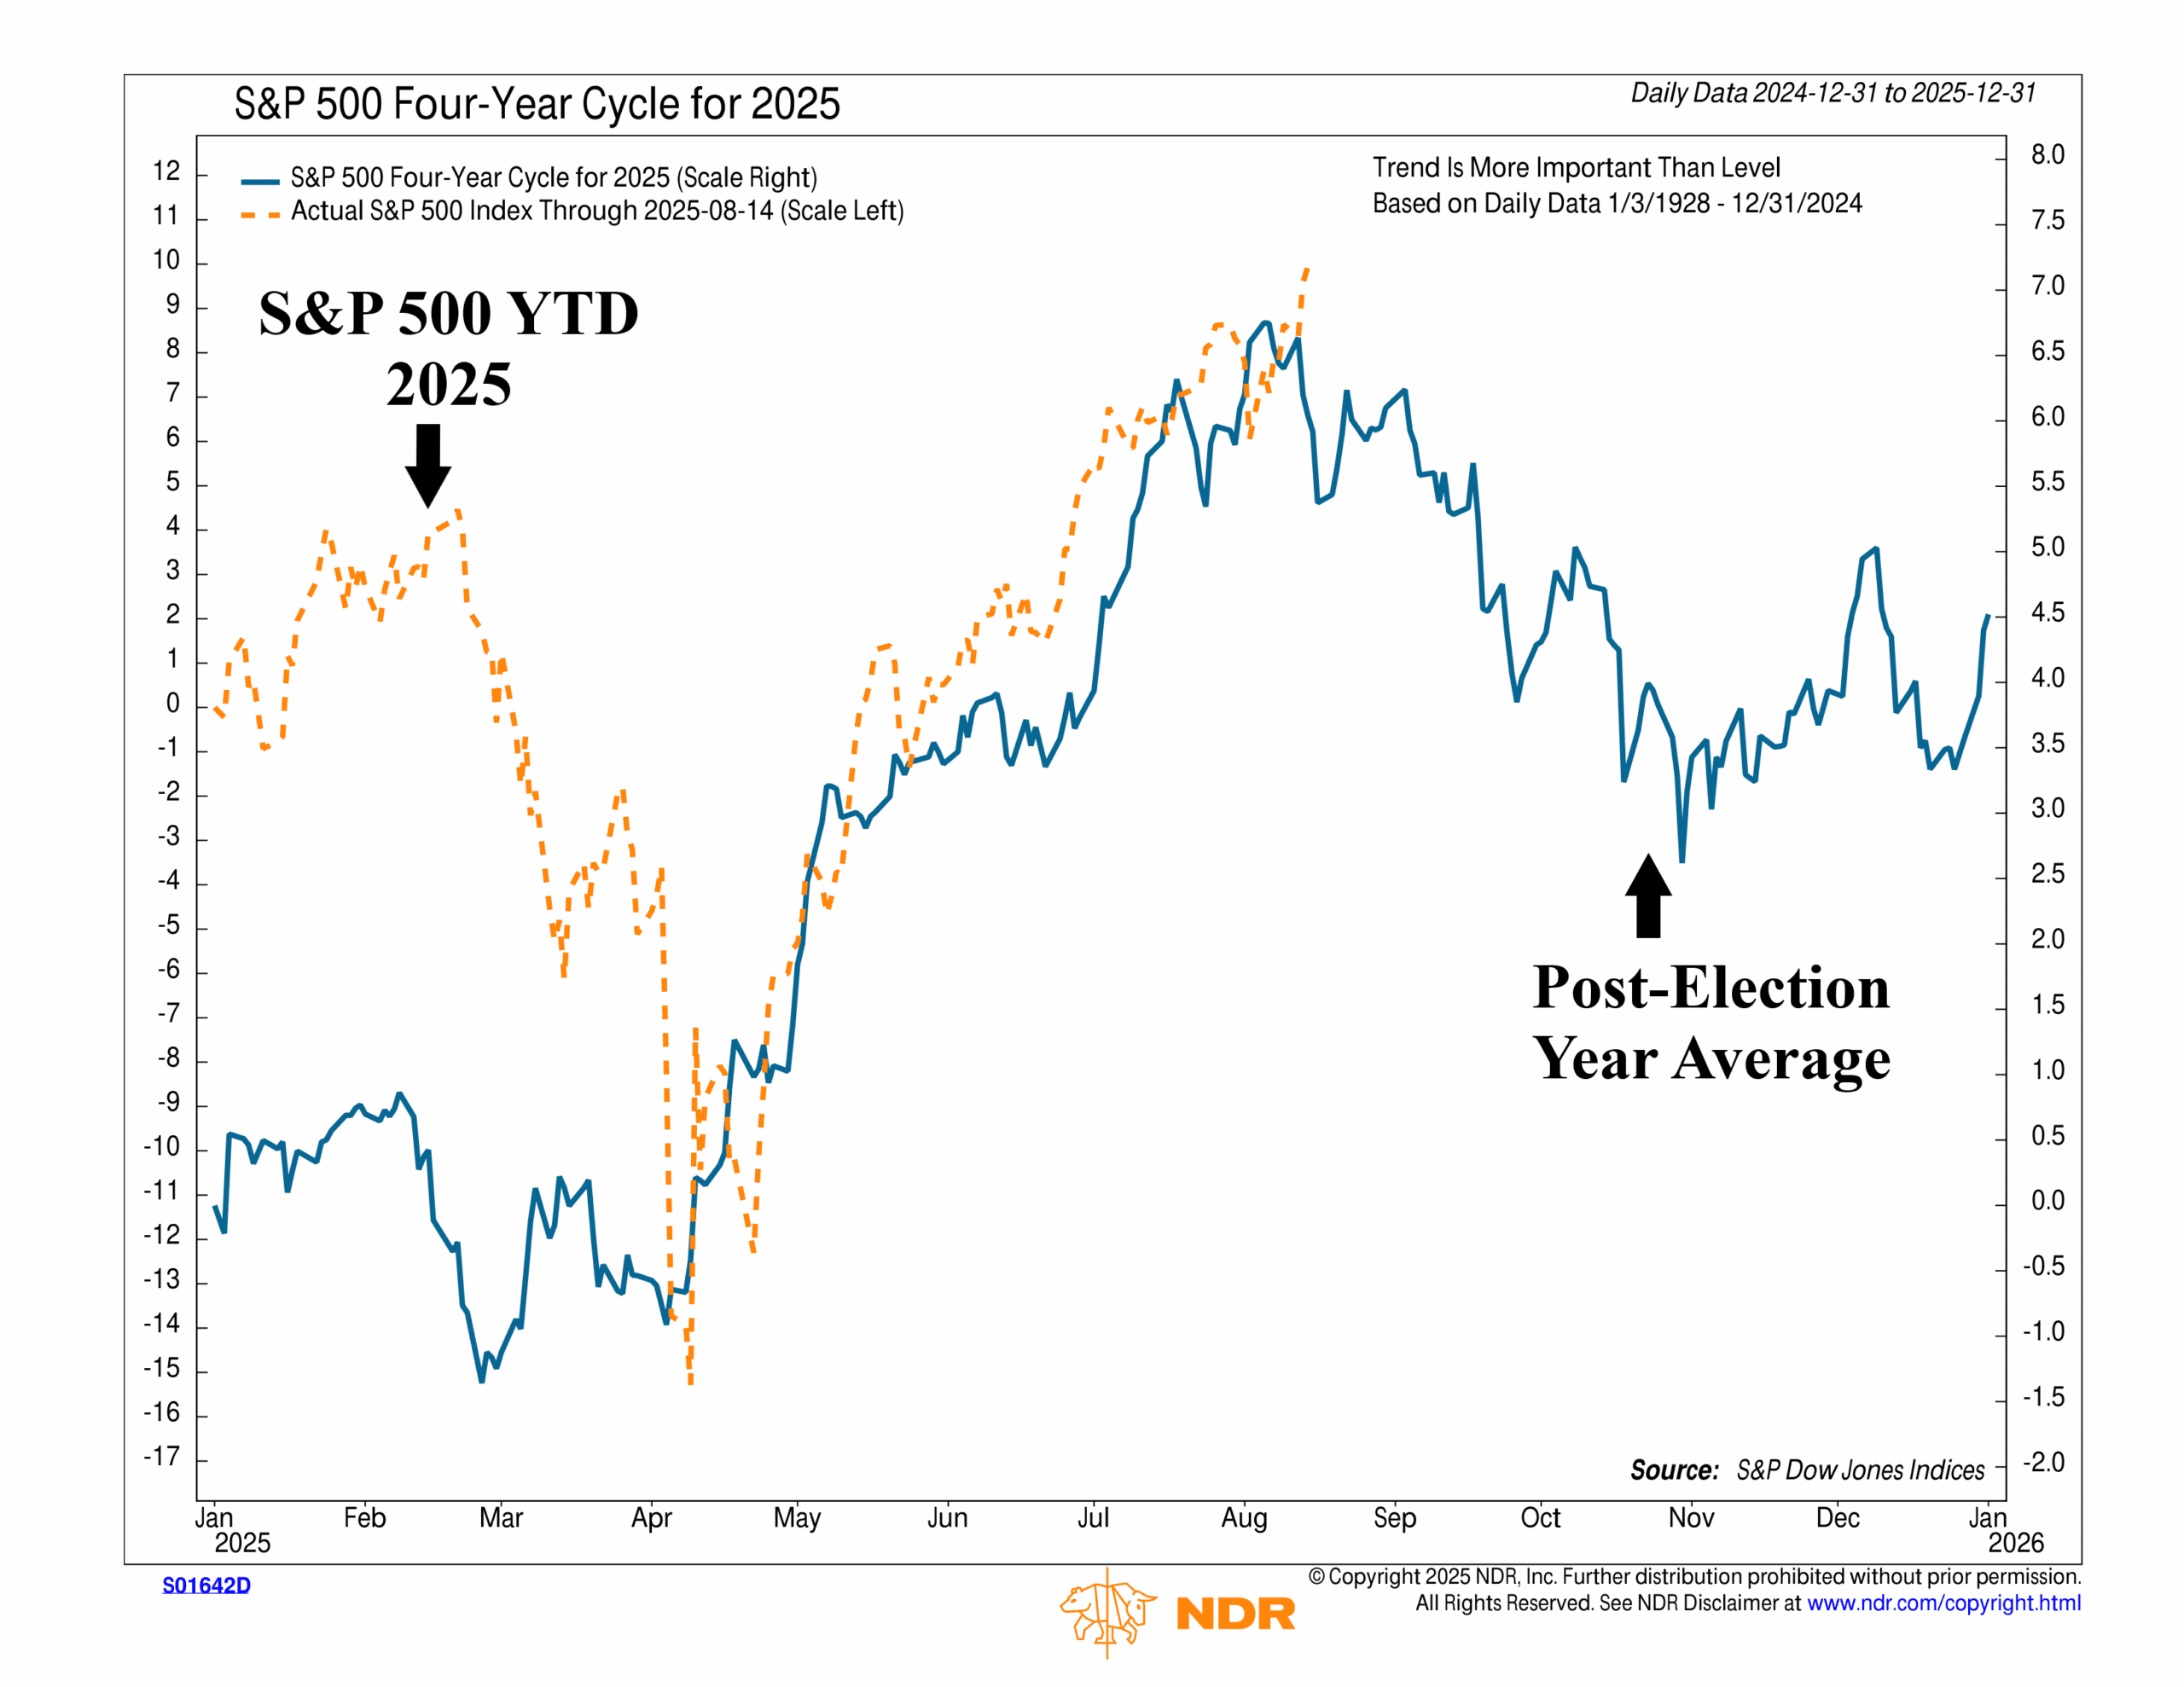
Despite all the headlines and big-picture drama this year, the stock market has been quietly following the historical, seasonal playbook pretty closely. As this week’s chart shows, the S&P 500’s path in 2025 has lined up closely with what typically happens in a post-election year.
The blue line shows the S&P 500’s average path in a post-election year, going all the way back to 1928. The orange dashed line is what’s happened so far in 2025—and I must say, it’s pretty eerie how close they’ve tracked each other this year. From the big downturn in April to the massive subsequent rally, the market has followed the “typical” post-election year pattern to a tee.
That’s the good news. But the not-so-good news is that, if history is any guide, this is usually where things get trickier. In many post-election years, the back half of August and into fall gets choppier, before eventually recovering a bit near the end of the year.
Now, this doesn’t mean the market has to follow the script. These are simply seasonal tendencies we’re talking about here. Nothing earth-shattering or super-scientific about any of this. But after such a cooperative stretch, I think this chart is a good reminder that good runs don’t last forever. We’ll keep a close eye on our models for the first hints of a slowdown so we’re ready if the market decides to change the story.
This is intended for informational purposes only and should not be used as the primary basis for an investment decision. Consult an advisor for your personal situation.
Indices mentioned are unmanaged, do not incur fees, and cannot be invested into directly.
Past performance does not guarantee future results.
The S&P 500 Index, or Standard & Poor’s 500 Index, is a market-capitalization-weighted index of 500 leading publicly traded companies in the U.S.