The stock market has been looking ahead, hoping for a peace agreement in the war involving Iran. While that would certainly be welcome news, this week’s chart suggests we likely aren’t out of the woods just yet.
The problem lies with disruptions to global supply chains. We had this issue during the covid crisis, and we saw how it affected global inflation with a lag.
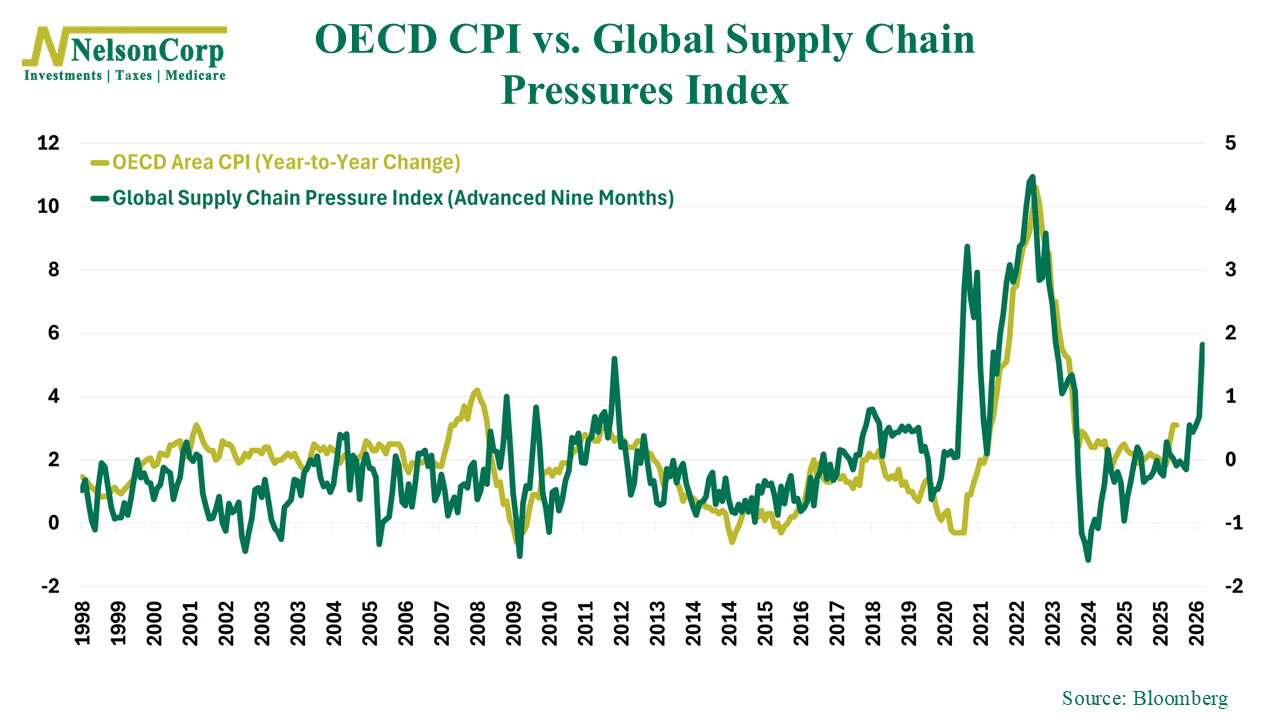
The chart above compares the Global Supply Chain Pressure Index (green line) to inflation across OECD countries (gold line). To account for the lag, the supply chain index has been shifted forward by nine months. This adjustment shows just how closely the two have moved over time.
In fact, the correlation between the two has been about 0.60, which is relatively strong for economic data. And as you can see, the Global Supply Chain Pressure Index moved sharply higher last month, reaching levels only surpassed by the Covid-era.
If history is any guide, that could mean we should brace for renewed global inflation pressures in the months ahead.
Of course, no single indicator is perfect, and many factors influence inflation. But still, this chart is a good reminder that supply chains still remain an important piece of the inflation puzzle.
Bottom line: Even if peace is coming, the damage done to the global economy could take a while to work its way through the system. Some of the effects may not show up until next year.
This is intended for informational purposes only and should not be used as the primary basis for an investment decision. Consult an advisor for your personal situation.
Indices mentioned are unmanaged, do not incur fees, and cannot be invested into directly.
Past performance does not guarantee future results.
The Global Supply Chain Pressure Index integrates transportation cost data and manufacturing indicators to provide a gauge of global supply chain conditions.