Corn is the focus of our featured chart this week, something we Midwesterners are plenty familiar with. If you haven’t noticed, its price has been on a tear lately: going from a low of about $3.1 per bushel in August of last year to about $7.50 per bushel today—a gain of over 140%!
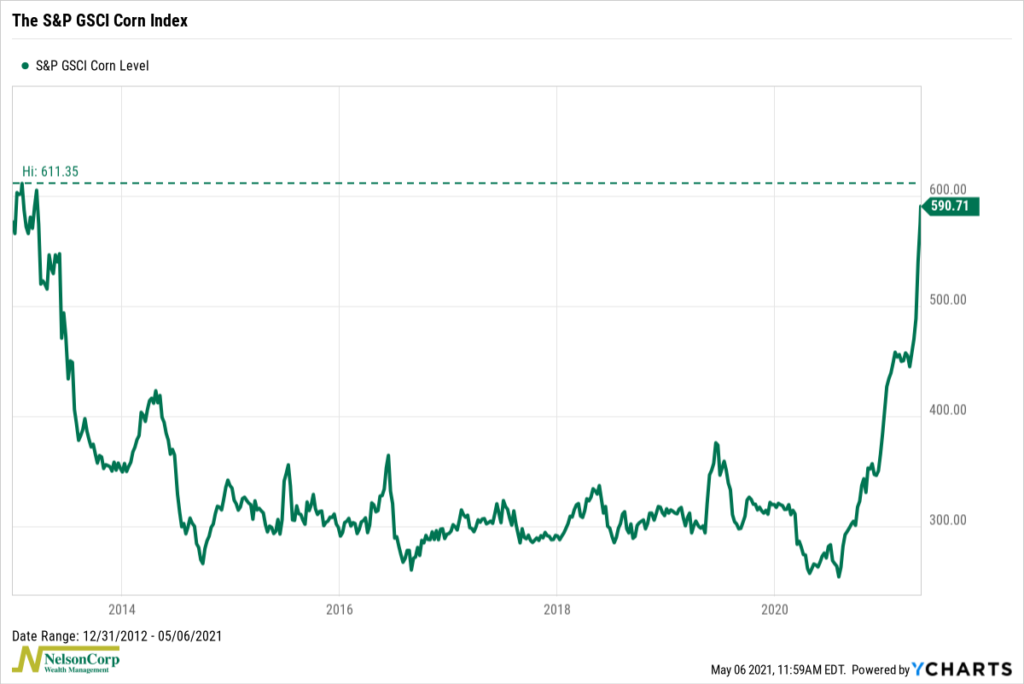
The chart above shows just how dramatic the move has been. In it, we plot the S&P GSCI Corn Index as a proxy for corn prices. Although this index isn’t showing the price of corn directly, it does act as a reliable benchmark for the investment performance of corn.
Looking at the chart, we can see how the price of corn has traced a “U” shape over the past decade or so. After collapsing in 2013 and 2014, corn prices went virtually nowhere for six years. But then, the post-pandemic recovery began in late 2020 with a significant restocking by China and a rebound in gasoline demand (and its associated corn-based ethanol component). Prices surged on the back of this greater demand. Drought has helped on the supply side of things, too. The result: The corn index is almost back to levels not seen since early 2013.
Corn, and commodities in general, are having their time in the sun. However, it has us wondering: Is this the start of a new commodities supercycle, or just a temporary imbalance between supply and demand?
This is intended for informational purposes only and should not be used as the primary basis for an investment decision. Consult an advisor for your personal situation.
Indices mentioned are unmanaged, do not incur fees, and cannot be invested into directly.
Past performance does not guarantee future results.