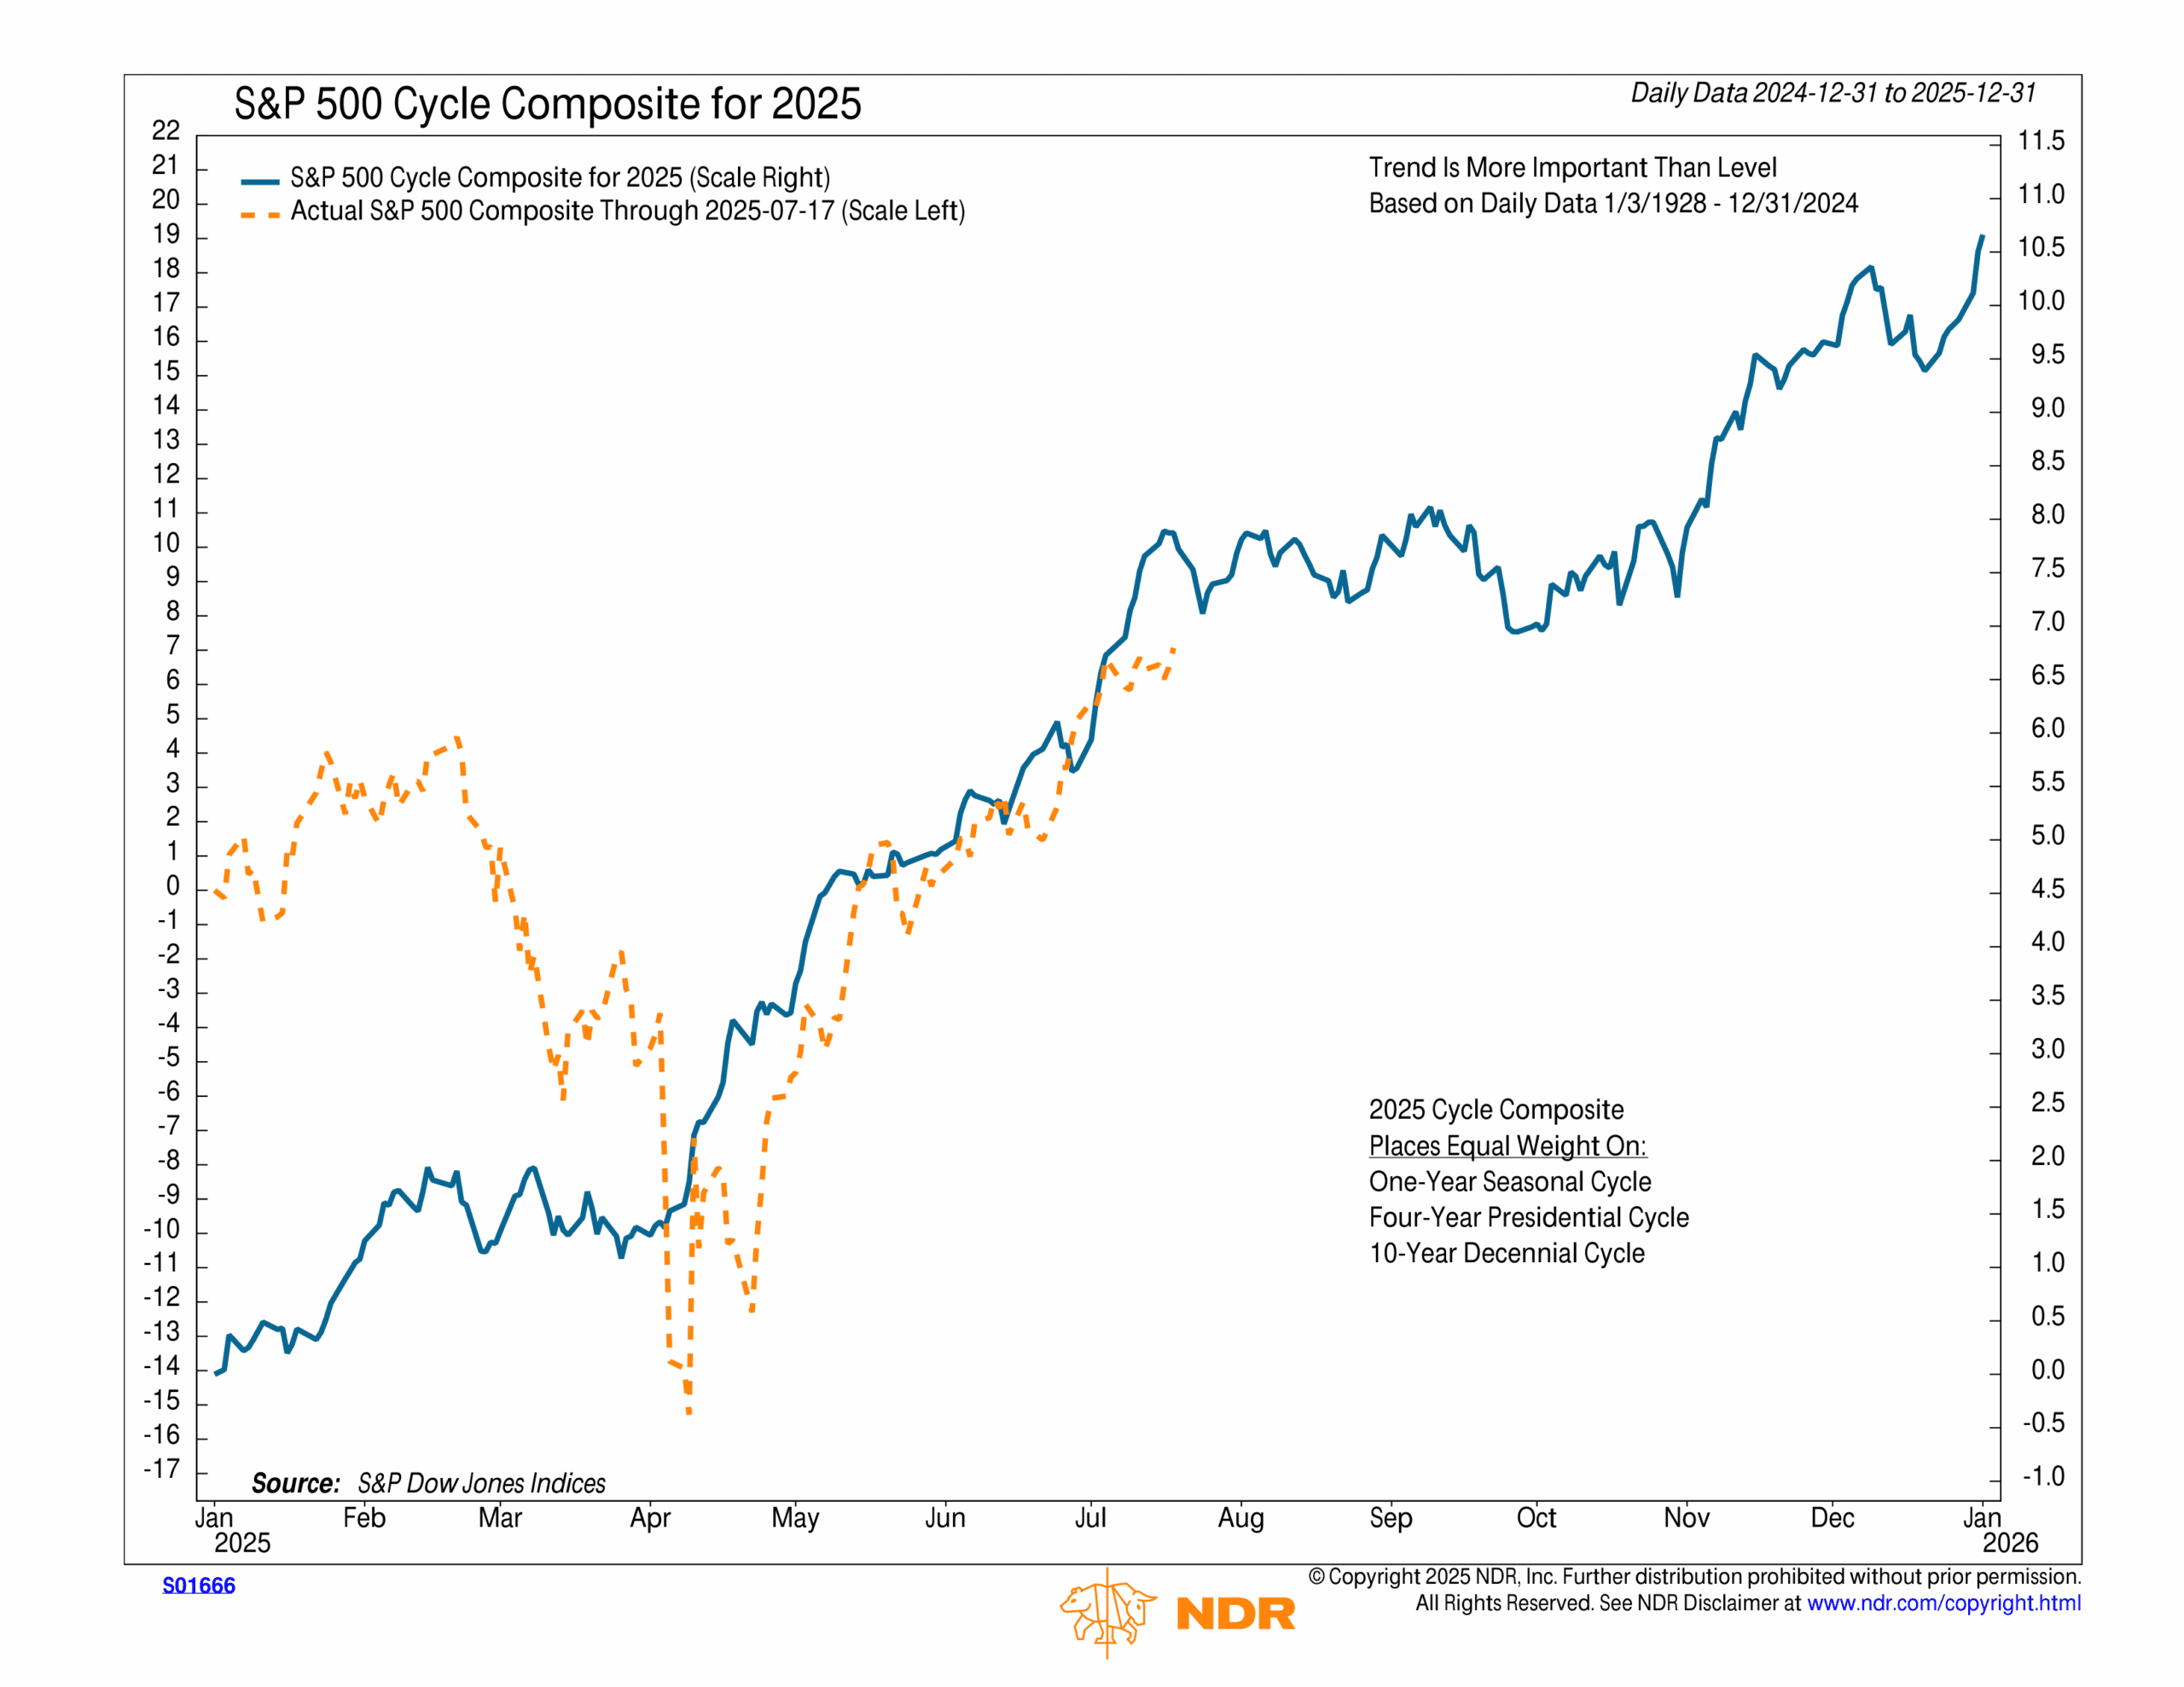
This week, I want to give an update on the NDR S&P 500 Cycle Composite for 2025.
What’s a cycle composite? Well, in this case, we look at how the S&P 500 index has historically performed, on average, over a typical 1-year period, 4-year presidential cycle, and 10-year decennial cycle. It uses data going all the way back to 1928. That’s nearly 100 years’ worth of data! We then combine all of this into one metric to create the blue line on the chart above.
In the financial world, we call this type of analysis “seasonality.” It essentially gives us a rough roadmap of what to expect in the market, without all the nuances. Think of it like a base-case scenario.
So where do things stand today? Well, the orange dotted line on the chart shows how the S&P 500 has actually performed so far this year. As you can see, it’s been tracking the cycle composite rather well. There was obviously a much larger sell-off in April—the Tariff Tantrum—but the market has rebounded pretty much in line with what the cycle composite would have predicted.
Which brings us to now. According to the chart, we’re about to enter a less bullish phase of the year. If history is any guide, the S&P 500 will likely tread water over the next few months as the market digests recent gains.
Of course, no analysis is perfect. Again, this is only a roadmap. But it does offer an interesting perspective on how to set expectations going forward.
This is intended for informational purposes only and should not be used as the primary basis for an investment decision. Consult an advisor for your personal situation.
Indices mentioned are unmanaged, do not incur fees, and cannot be invested into directly.
Past performance does not guarantee future results.
The S&P 500 Index, or Standard & Poor’s 500 Index, is a market-capitalization-weighted index of 500 leading publicly traded companies in the U.S.