
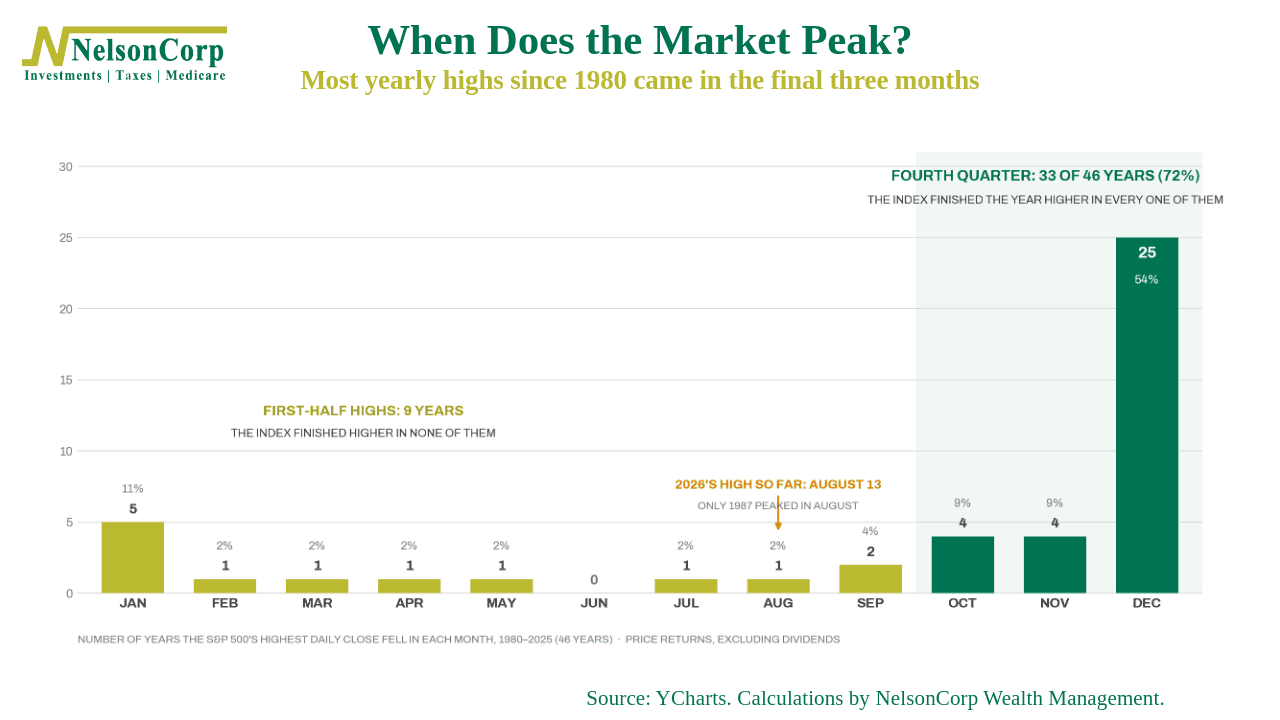
The S&P 500 stock index last hit a high on August 13. Since then, it has drifted lower. But now that we’re in the final quarter, the question becomes: is the high for the year already in?
History says that would be unusual.
The chart above shows the month in which the S&P 500 hit its highest close of the year, for every year from 1980 through 2025. Each bar counts the years.
As you can see, the pattern is quite lopsided. The high came in the fourth quarter in 33 of those 46 years, or about 72% of the time. December alone accounts for 25 of them, more than half. And August has been the top of the year exactly once, in 1987.
Why? Well, there is a simple reason. Stocks go up more often than they go down. The index finished higher in 35 of the 46 years, and when a market is rising, its best day tends to come late.
The month of the high also says a lot about the year. When the high came in the fourth quarter, the index finished up every single time, by an average of about 18%. When the high came in the first half of the year, it never finished higher. That’s right—never. Nine years, nine flat or down finishes. Of course, you only know which kind of year it was after the fact.
The bottom line? Most years have saved their best for last. Whether this one does is still an open question, but an August high would be rare.
This is intended for informational purposes only and should not be used as the primary basis for an investment decision. Consult an advisor for your personal situation.
Indices mentioned are unmanaged, do not incur fees, and cannot be invested into directly.
Past performance does not guarantee future results.
The S&P 500 Index, or Standard & Poor’s 500 Index, is a market-capitalization-weighted index of 500 leading publicly traded companies in the U.S.