This week, I want to highlight an indicator that interprets the Federal Reserve and its monetary policy actions a bit differently than we’re typically used to.
For example, when we usually talk about a “tightening cycle,” it tends to be seen in a negative light. After all, interest rates are rising, and higher rates tend to create headwinds for financial assets like stocks and bonds.
However, there’s a different way to view all this, especially when we take a step back and look at the bigger picture.
Think about the environment in which the Federal Reserve (or any central bank, for that matter) feels the need to raise rates. Inflation may be running hot, sure, but that often means economic activity is running strong as well. (While that’s not always the case, it has frequently been true throughout history).
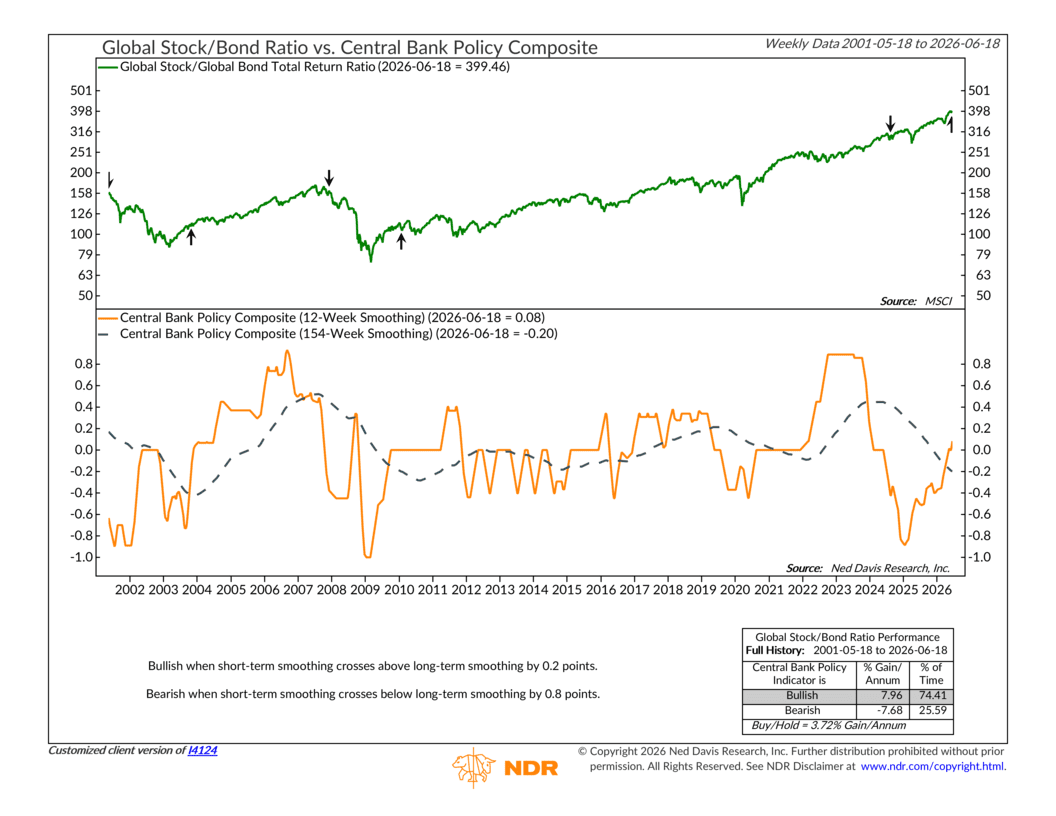
This indicator takes advantage of that relationship. It does so through the Central Bank Monetary Policy Composite, shown as the orange line on the chart above. The composite represents the weighted average change in the direction of shorter-term interest rates targeted by the four major global central banks: the U.S. Federal Reserve, the Bank of Japan, the Bank of England, and the European Central Bank.
The concept is fairly straightforward. When the 12-month average of the Central Bank Monetary Policy Composite rises 0.2 points above its 154-week smoothing average, it signals the start of a long-term tightening cycle—and historically, that has been bullish for stocks. The reasoning is that central banks are typically raising rates because economic growth is strong and corporate earnings prospects are improving.
On the other hand, when the composite falls 0.8 points below its long-term average, it suggests central banks are attempting to stimulate weaker economies. Historically, those environments have generally been associated with softer stock market returns.
Looking at the chart, you can see that these signals have been remarkably effective. There have only been about six signals since 2001, but they have generally done a good job of identifying the market’s long-term trend.
The latest signal was a “buy” signal generated on June 12. This is because central banks are beginning to move toward a tightening cycle, something we highlighted in last week’s featured indicator. The difference here is that this indicator interprets tighter policy as evidence that economic conditions remain healthy around the world—a backdrop that has historically supported stronger stock market performance.
The bottom line: while rising interest rates are often viewed as a negative for investors, they can also be a sign of economic strength. History suggests that when central banks are confident enough to tighten policy, it has often coincided with periods of solid economic growth and favorable long-term returns for stocks.
This is intended for informational purposes only and should not be used as the primary basis for an investment decision. Consult an advisor for your personal situation.
Indices mentioned are unmanaged, do not incur fees, and cannot be invested into directly.
Past performance does not guarantee future results.