This week’s insight starts with a quick trip down economic history lane. For decades, two schools of thought have debated what really drives the economy. Monetarists believe the answer lies in the money supply. In times of economic weakness, increases in the money supply can stimulate economic activity. In times of excessive economic activity, reductions in the money supply can stifle economic activity. Keynesians, on the other hand, focus on government spending, arguing that boosting spending can help fight downturns, while pulling back can cool off an overheated economy.
Instead of choosing sides, this week’s indicator combines both schools of thought, along with the impact of the dollar, into one practical measure. It’s called the Real Monetary, Fiscal, and Exchange Rate Policy Index, and it gives us a way to track the overall level of policy stimulus working through the economy and markets.
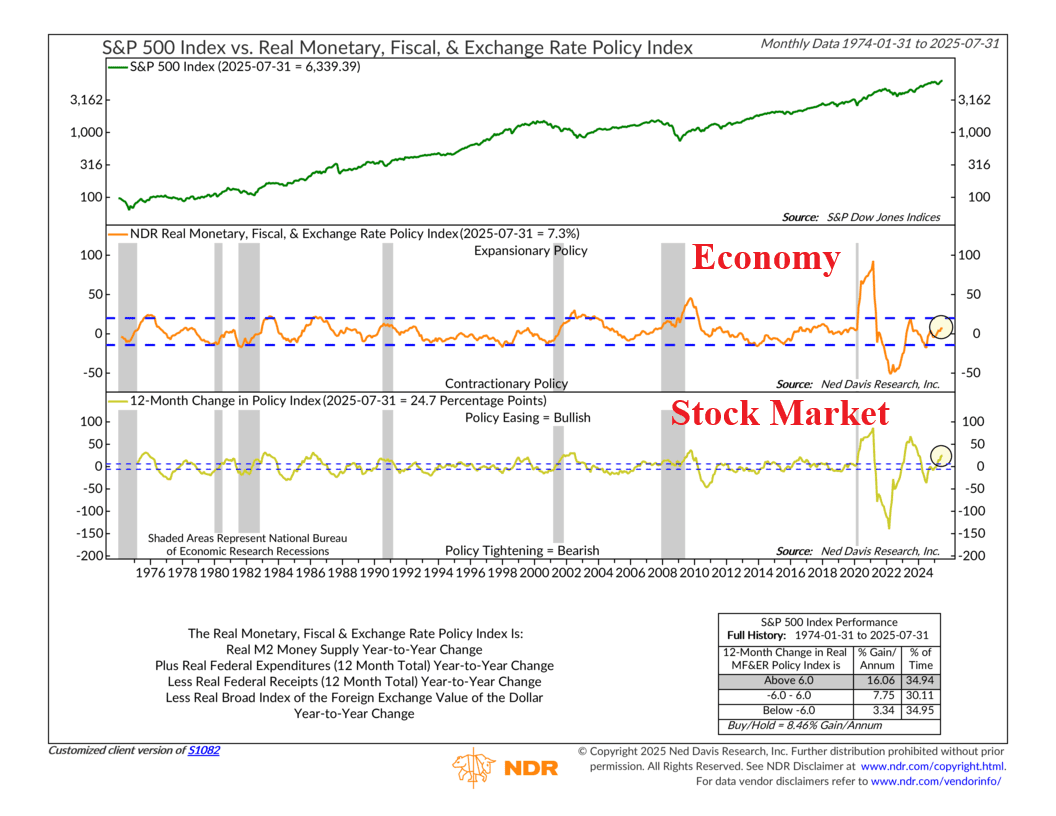
Let’s walk through the chart. On top, we have the familiar S&P 500 Index and its performance over time. Below that, in the next two clips, we have our indicator. Both show the Policy Index mentioned above, but in different ways.
The middle section shows the Policy Index itself but framed around how it affects the real economy. When the line is above the top blue dashed line, policy is expansionary, meaning the economy is being supported. When it falls below zero, policy turns contractionary. Right now, the index has climbed back into positive territory, but it’s not yet strong enough to push the economy into a fully bullish phase.
And then on the bottom clip, we have the same Policy Index but with its 12-month change applied, which has historically done the best job of telling us what the stock market—not the economy—is going to do. When the line is rising, it means financial conditions are easing, which tends to be bullish for stocks. And today, you can see that the line is clearly positive. In other words, the market is already feeling the benefits of easier policy, even though the broader economy hasn’t caught up yet.
So, let’s put it all together. This indicator says that all three factors—the money supply, government spending, and U.S. dollar performance—affect the real-world dynamics of the economy and the stock market. By combining the growth rates of the money supply, federal expenditures, and the dollar into a single index, this indicator measures the total stimulus being provided to our domestic economy.
Right now, policy is turning supportive. The stock market is feeling it first, which is typical since markets react faster. The economy takes more time—usually around six months—to reflect those shifts. That lag explains why things may still feel sluggish, almost stagflationary, in the near term even as the market looks ahead. Looking forward, however, combining looser financial conditions with the OBBB stimulus expected next year should create a demand-driven boost for the economy. It just requires patience, because policy always takes time to work its way through the system.
This is intended for informational purposes only and should not be used as the primary basis for an investment decision. Consult an advisor for your personal situation.
Indices mentioned are unmanaged, do not incur fees, and cannot be invested into directly.
Past performance does not guarantee future results.
The S&P 500 Index, or Standard & Poor’s 500 Index, is a market-capitalization-weighted index of 500 leading publicly traded companies in the U.S.