In the past we’ve talked about volatility and the different ways of measuring it. The VIX, or Wall Street’s “Fear Index,” is a popular measure because it tells us how much investors expect the stock market to swing over the coming month. It measures implied, not actual, volatility. When it moves higher, fear is rising, and when it drifts lower, investors are expecting a calmer market.
But how do we actually quantify that? How quickly does the VIX need to rise or fall before it becomes a meaningful trading signal?
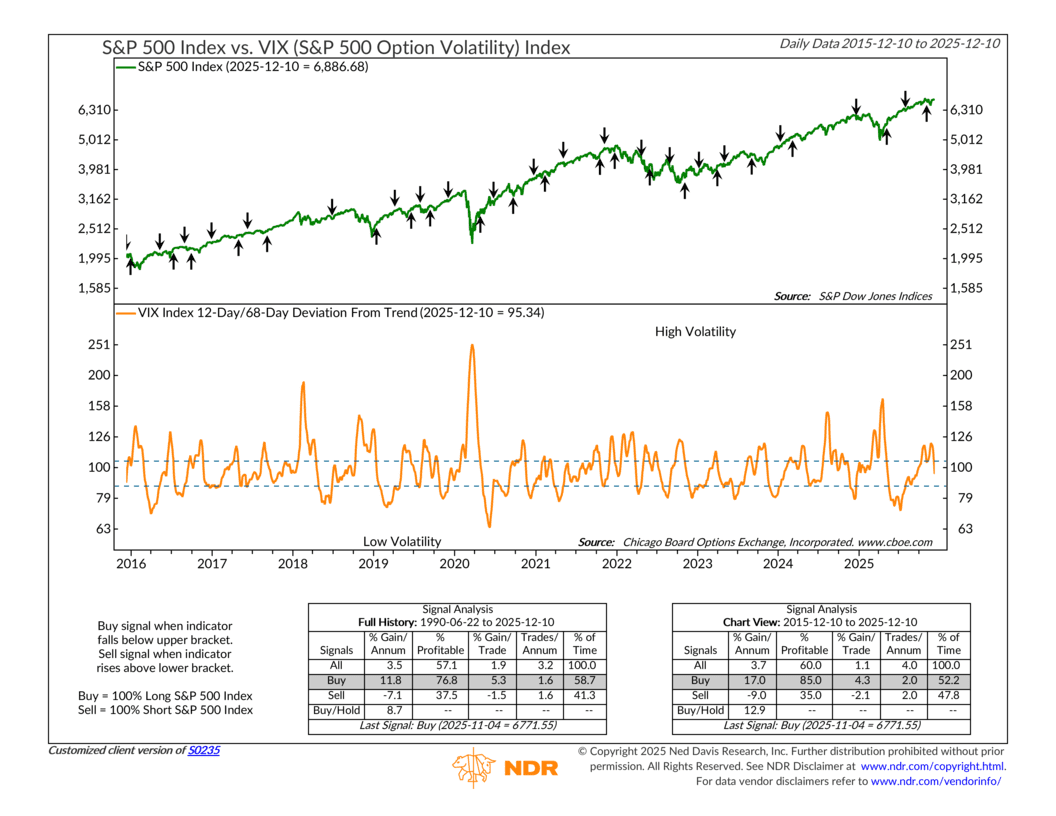
That’s where this week’s indicator comes in. It uses a technique called deviation-from-trend to show whether the VIX is, well, deviating from its trend. It compares the VIX’s 12-day average to its 68-day average, which is what produces the orange line in the bottom half of the chart. When that line jumps above the upper dashed line and then reverses back below it, the model triggers a buy signal for the S&P 500. And when the line falls below the lower dashed line and then reverses higher, it generates a sell signal.
Put simply, high but falling volatility is good for stocks, and low but rising volatility is bad for stocks. The idea is simple, but the history behind it is impressive. Since 1990, buying after a high and falling volatility reading has delivered strong annualized returns with a high rate of profitable trades. The sell signals show a similar level of reliability.
This indicator matters right now because it just flashed one of those high but falling volatility buy signals. The VIX had been climbing through the fall, and after a couple of sharp surges last month, it has started to roll over. If history is any guide, that shift points to a more favorable environment for taking on equity risk.
Ultimately, volatility reversals tend to show changes in the market’s tone before everything else catches up. Fear looks to be easing, the signal has turned positive, and for now the backdrop appears more supportive for stocks than it did just a few weeks ago.
This is intended for informational purposes only and should not be used as the primary basis for an investment decision. Consult an advisor for your personal situation.
Indices mentioned are unmanaged, do not incur fees, and cannot be invested into directly.
Past performance does not guarantee future results.
The S&P 500 Index, or Standard & Poor’s 500 Index, is a market-capitalization-weighted index of 500 leading publicly traded companies in the U.S.