
Picture a house on your street listed for way more than anything nearby has ever sold for. It sits there for a while. Then one morning the listing shows a price cut. Nothing is wrong with the house. But the message is pretty clear—the seller was asking more than buyers would pay, and the price has started heading the other way.
The stock market is sending a similar message right now.
The headlines this week have mostly been about the election, and stocks have been volatile. But underneath, the price tag on stocks is still one of the highest on record. And as of the end of October, it has started slipping.
So, for this week, let’s look at an indicator that combines those two ideas—how expensive stocks are, and which way the price is heading.
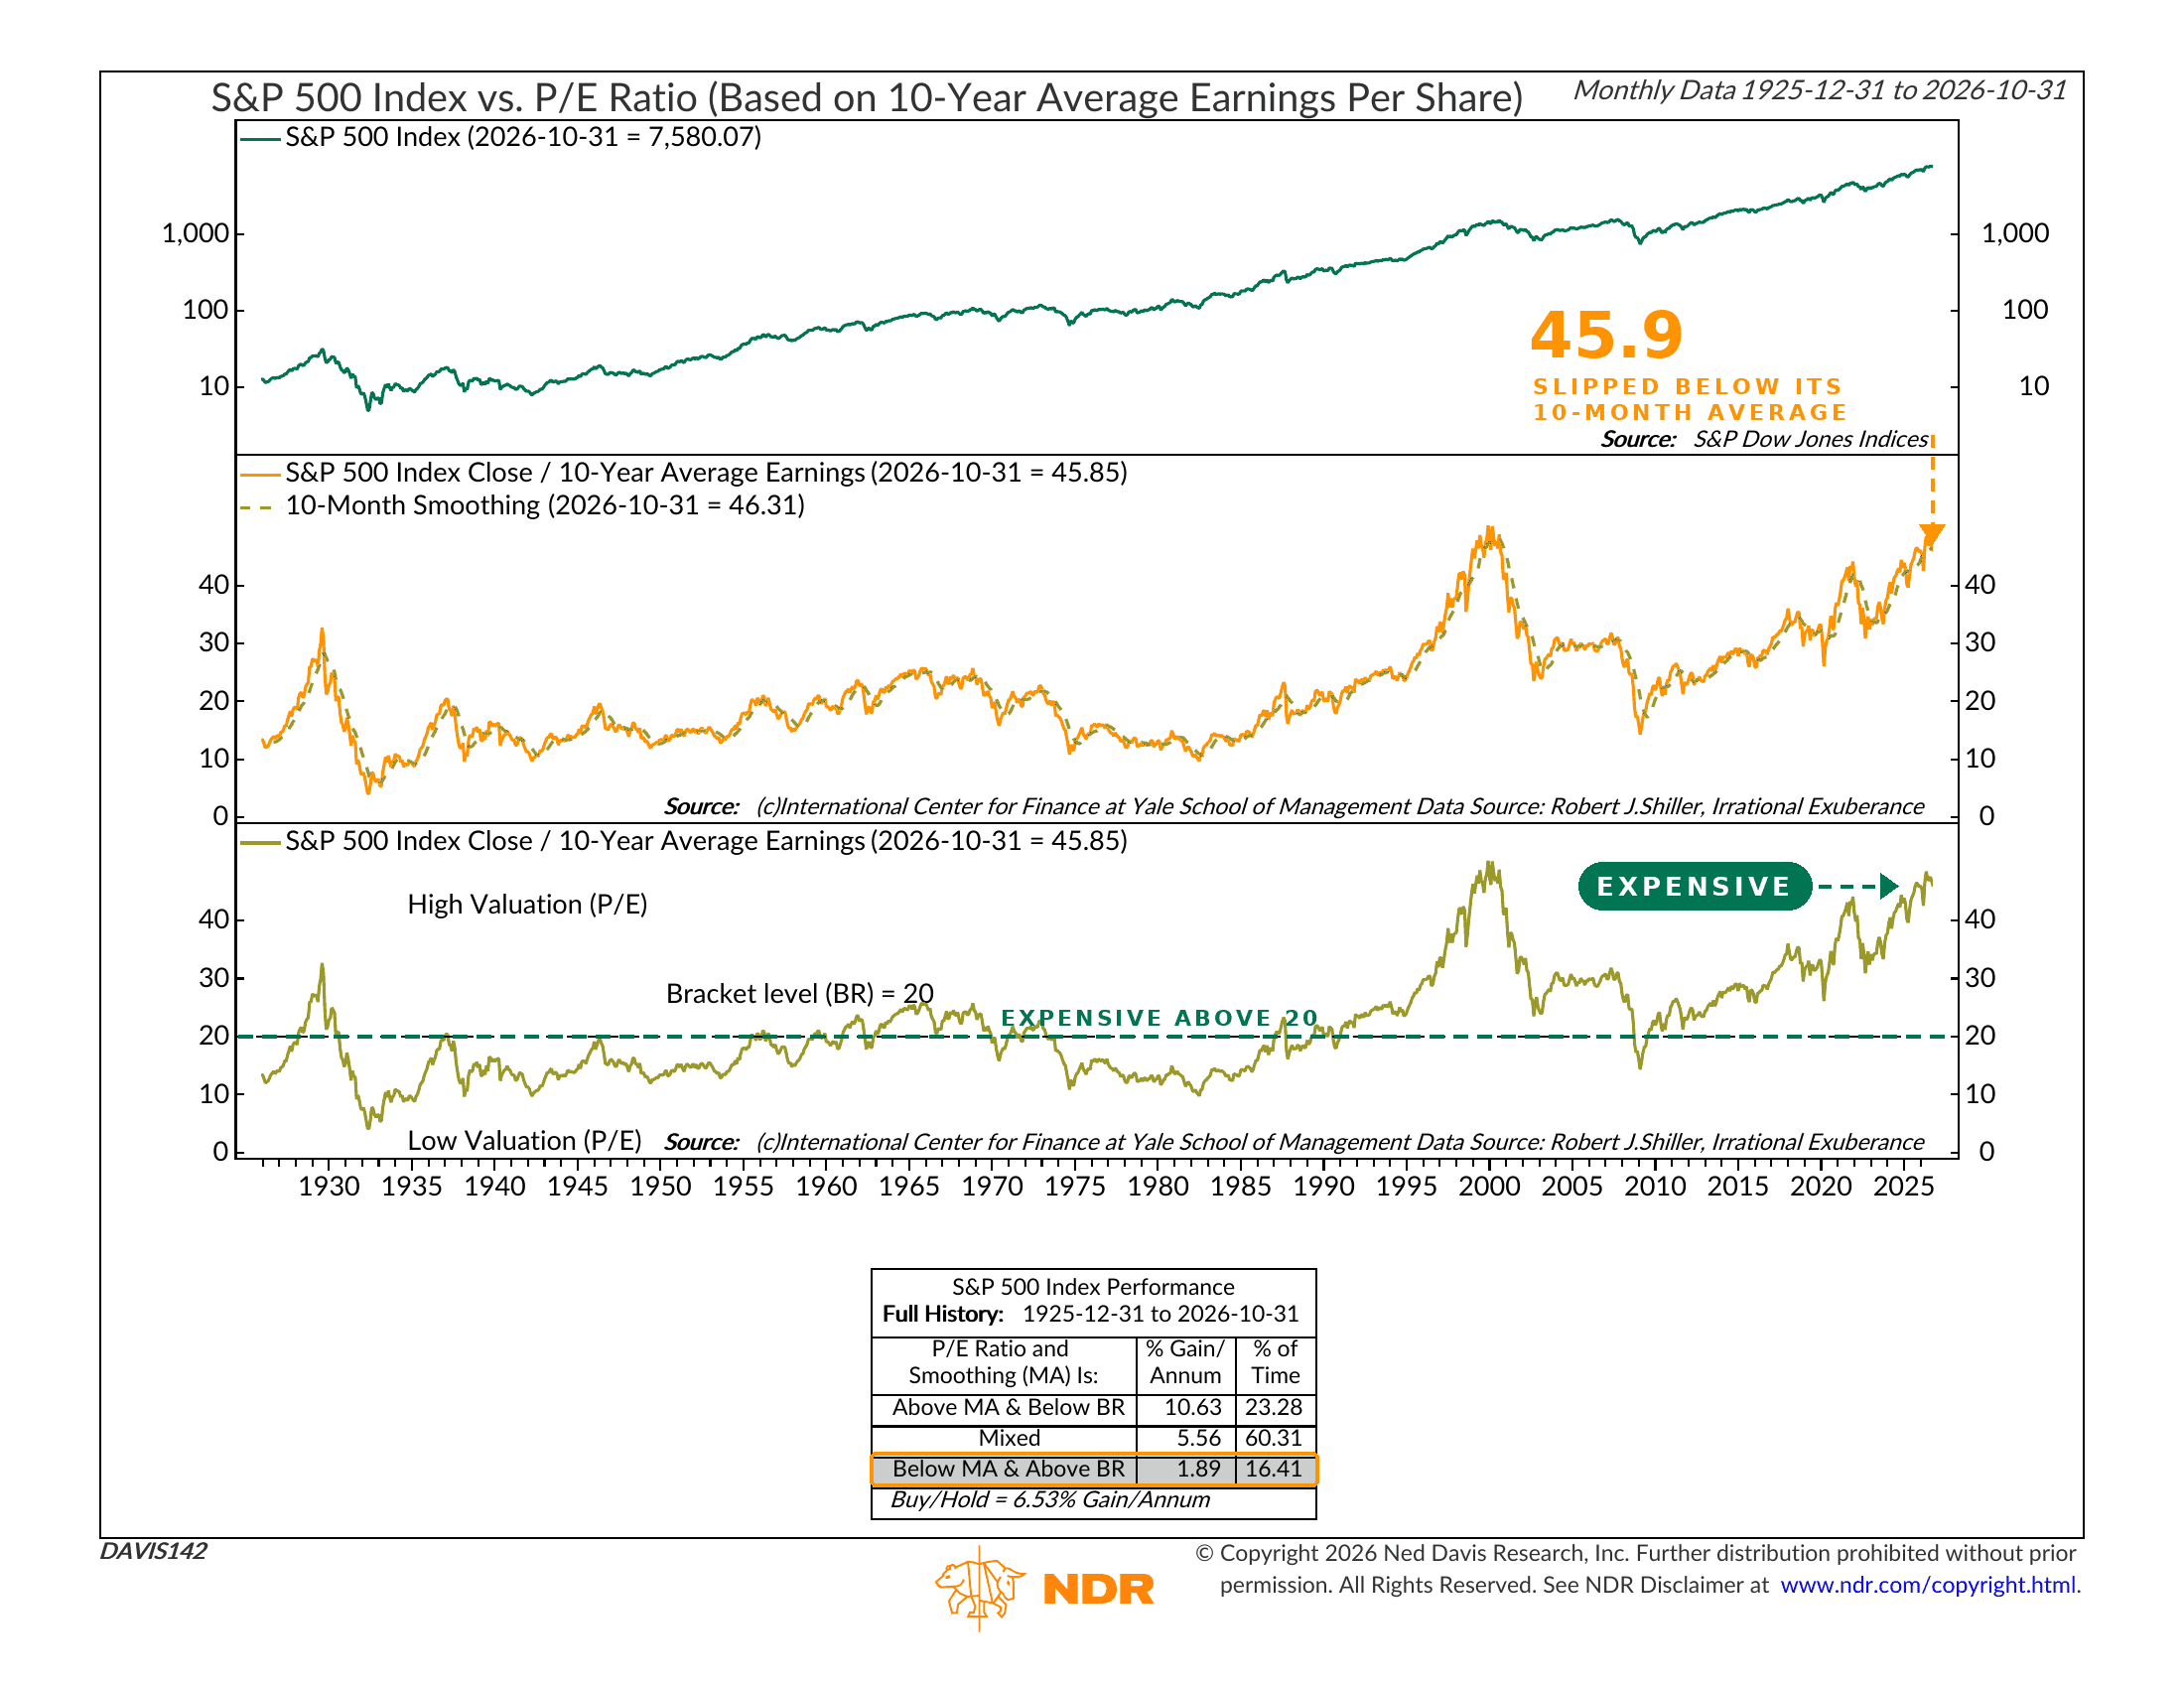
Here’s how it works. The middle panel of the chart shows the S&P 500’s price divided by its average earnings over the past ten years. The ten-year average smooths out the booms and busts in profits, so you get a cleaner read on what investors are paying for each dollar of earnings. The dashed line is a ten-month average of that same ratio, which tells you the direction it’s moving.
The bottom panel adds one more piece: a line at 20. Readings above 20 count as expensive. Readings below 20 count as cheap. That’s it. Pretty simple.
Put those together and you get three situations. The best one is when stocks are cheap and the ratio is rising—buyers are lining up for a bargain. The worst is when stocks are expensive and the ratio is falling—buyers are starting to walk away from a high price. Everything else lands in the middle.
Now look at the performance box. Going back to 1925, the S&P 500 has gained about 10.6% per year in the cheap-and-rising setup. In the mixed zone, it has gained about 5.6% per year. But in the expensive-and-falling setup, it has gained just 1.9% per year. That compares with 6.5% per year for simply buying and holding over the same century.
So where are we now? As of October 31 (this indicator updates monthly), the ratio sits at 45.85. In plain terms, investors are paying about $46 for every $1 of earnings. Only the peak of the dot-com bubble in 1999 and 2000 was higher. That is well above the line at 20—no surprise there. But the new part is the direction. The ratio has just dropped below its ten-month average of 46.3. In other words, stocks are expensive, and the price tag has started to slip. That is the weakest of the three zones, and it has only been in effect about 16% of the time.
Now, a word of caution. Valuation is a terrible timing tool. This ratio has been above 20 for most of the past 30 years, and the market has done just fine through much of it. The crossover below the average can also flip back quickly—it did that in late 2018 and again in early 2020, when sharp dips reversed within a few months. And corporate earnings have been growing fast lately, which the ten-year average is slow to reflect.
Still, though, the message here is about reward. At these prices, and with momentum fading, the payoff for taking risk is getting pretty iffy.
The bottom line? When a house is priced above everything on the street and the first price cut shows up, not many rush in to buy. The same logic applies here. The market can still grind higher, but the odds of being rewarded for taking risk have gotten slimmer. That fits with the more cautious tone we’ve been describing recently, and is another piece of the puzzle to keep in mind.
This is intended for informational purposes only and should not be used as the primary basis for an investment decision. Consult an advisor for your personal situation.
Indices mentioned are unmanaged, do not incur fees, and cannot be invested into directly.
Past performance does not guarantee future results.
The S&P 500 Index, or Standard & Poor’s 500 Index, is a market-capitalization-weighted index of 500 leading publicly traded companies in the U.S.