Stocks or bonds? It’s a question every investor wrestles with sooner or later. These two asset classes are the heavyweights—the benchmarks—that drive long-term portfolio returns. Sure, you could stick with a fixed mix and let it ride. But in our view, that’s risky. Market conditions shift, and some periods clearly favor stocks while others lean toward bonds.
That’s why this week we’re highlighting a stock/bond relative strength indicator. It’s a tool that helps us see which side of the market has the edge, and whether it makes more sense to play offense or defense.
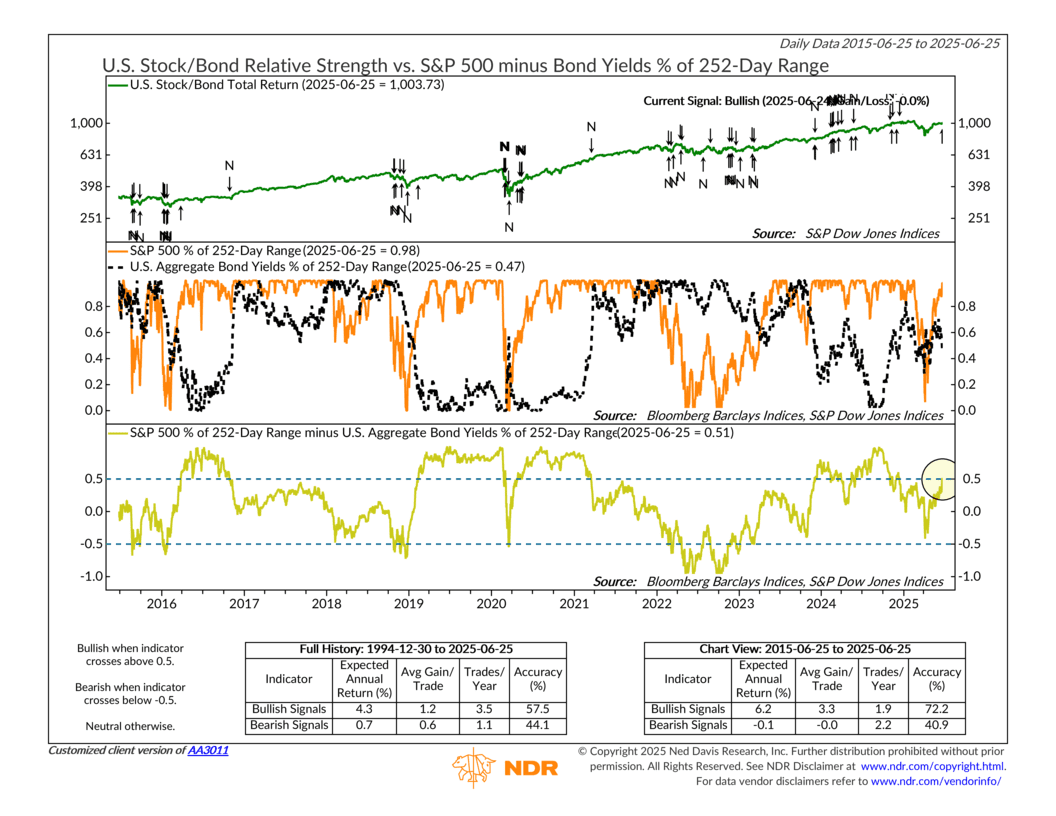
At the top of the chart, you’ll see the stock/bond ratio, which simply tracks how stocks are performing relative to bonds. When the line moves higher, stocks are leading. When it drops, bonds are in control.
Beneath that, we break it down further. The orange line shows where the S&P 500 sits within its trailing 252-day (one-year) range. The black line does the same for U.S. bond yields. At the very bottom, the gold line plots the difference between those two. That’s the indicator we’re watching.
So how does it work? When stocks are climbing toward the top of their range and bond yields are flat or falling, the indicator moves higher. A reading above +0.5 is considered bullish. Below -0.5 is bearish. Anything in between is neutral.
Historically, it’s done a good job flagging whether equity strength is on solid footing. Over the past decade, bullish signals have led to average annualized returns of 6.2%, with a hit rate north of 70%. Bearish signals, on the other hand, have often been followed by weaker returns or increased volatility.
As of June 25, the indicator just flipped bullish, crossing above the +0.5 threshold with a reading of +0.51. That suggests stocks are gaining ground faster than bond yields, a positive sign for risk assets and a potential shift in momentum.
The bottom line? Stock strength is outpacing bond yields, and that’s historically been a good sign for risk assets. For now, the indicator is leaning toward offense. But as always, we keep risk management front and center. No single reading makes the playbook, but it helps guide how we think about where the market’s strength is showing up.
This is intended for informational purposes only and should not be used as the primary basis for an investment decision. Consult an advisor for your personal situation.
Indices mentioned are unmanaged, do not incur fees, and cannot be invested into directly.
Past performance does not guarantee future results.
The S&P 500 Index, or Standard & Poor’s 500 Index, is a market-capitalization-weighted index of 500 leading publicly traded companies in the U.S.