
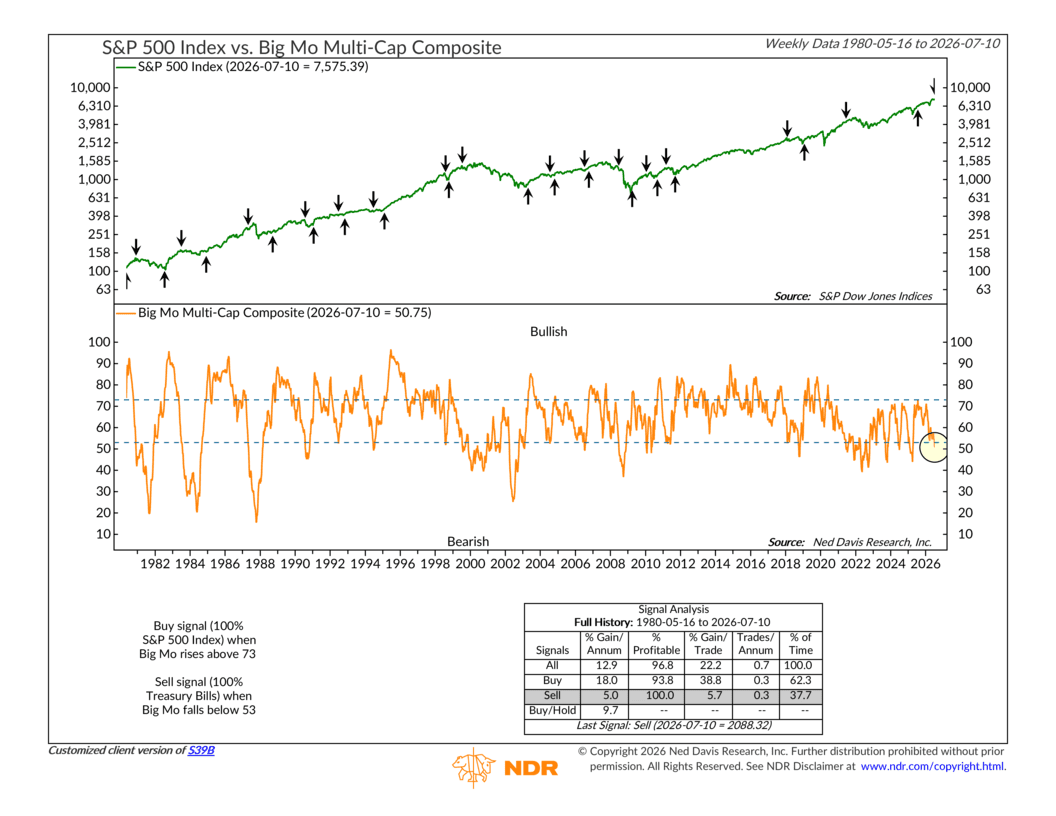
This week we’re talking Big Mo. Big Momentum. It’s an important indicator because it encapsulates exactly the kind of process we prefer to use when building our models.
That process is what we call the “weight of the evidence.” The idea is pretty straightforward. Instead of relying on any single indicator, Big Mo combines more than 100 individual signals into one reading that measures the overall health of the stock market.
It does this by blending two major components. The first looks at the market itself. Is trend and momentum strong across a broad range of industries? If so, this component scores positively. The second looks at the broader backdrop, including the economy, monetary conditions, valuations, and investor sentiment. Put them together, and you get the reading shown in the lower half of the chart.
Historically, it’s been a pretty useful guide. When the Big Mo reading rises above 73, the S&P 500 has tended to outperform its long-term average. When it falls below 53, returns have generally been much weaker, prompting the model to move defensively into Treasury bills. Since 1980, that disciplined approach has produced an annualized return of roughly 18% during bullish signals while spending only about 62% of the time invested in stocks.
More recently, Big Mo flashed a bullish signal last summer, which turned out to be a pretty good call. Today, however, the indicator sits around 51, placing it just below the model’s lower threshold. That’s a bearish signal—and a sign that momentum beneath the surface has deteriorated meaningfully compared to where it was last year.
Does that mean a bear market is coming? Not necessarily. No indicator is perfect. And markets can remain resilient even when conditions aren’t ideal. However, readings like this are a reminder that’s it’s easy to miss what’s happening underneath. A market making new highs while fewer indicators support the advance often deserves a little extra attention.
As always, we believe it’s best to let the evidence guide the path. Right now, Big Mo suggests the environment has become less favorable than it was just a few months ago. The question now is whether the rest of the weight of the evidence follows Big Mo’s lead, or whether this proves to be just a temporary blip.
This is intended for informational purposes only and should not be used as the primary basis for an investment decision. Consult an advisor for your personal situation.
Indices mentioned are unmanaged, do not incur fees, and cannot be invested into directly.
Past performance does not guarantee future results.
The S&P 500 Index, or Standard & Poor’s 500 Index, is a market-capitalization-weighted index of 500 leading publicly traded companies in the U.S.