When big moves happen in the stock market, they tend to be global in nature. In other words, stock price momentum in one country can spill over into other countries, creating what we call a “mega-move” in global financial markets.
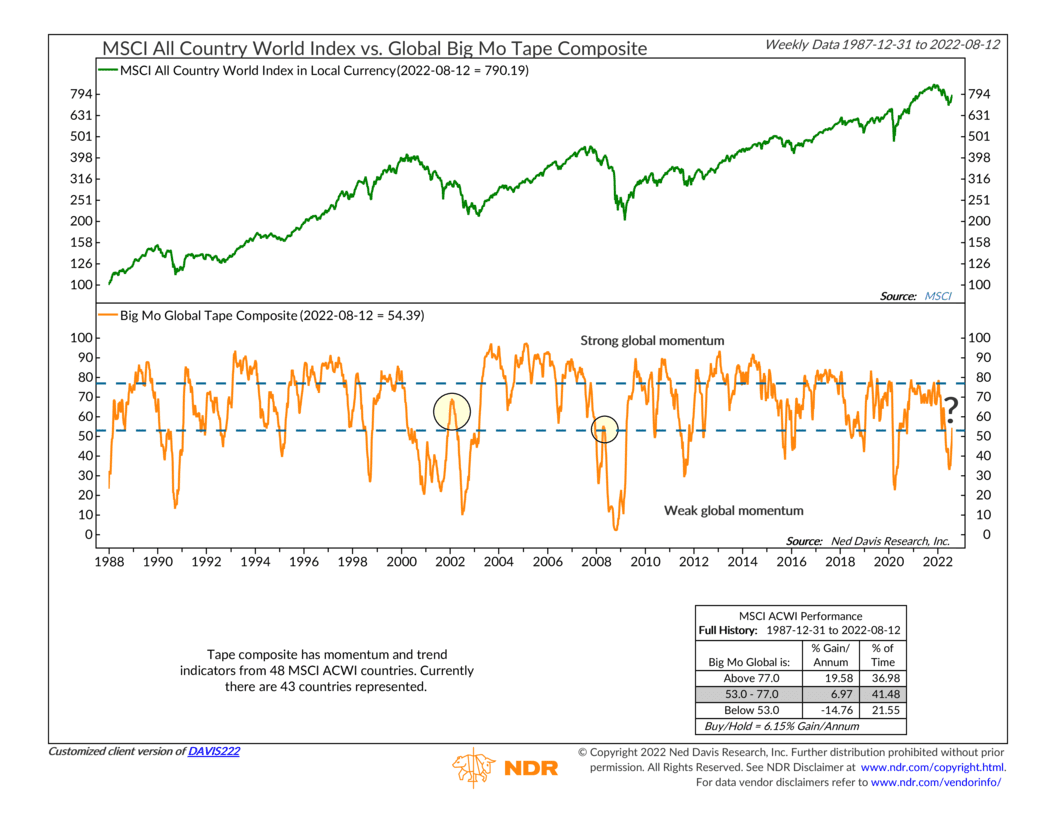
To measure this dynamic, we look at a special type of tool called the Global Big Mo Tape Composite. Big Mo, in this case, means Big Momentum. The indicator, shown above, uses a combination of purely price-based trend and momentum indicators to measure the degree of momentum in the countries that make up the MSCI ACWI (a global stock market index).
The combined reading is shown as the orange line on the chart. Historically, when it has risen above a reading of about 77 (the upper dashed line), it’s been a sign of strong upside momentum in global stocks. On average, the MSCI ACWI has returned roughly 19.5% per year when the indicator has gotten this high. However, when global momentum falls and the indicator drops below a reading of around 53 (the lower dashed line), global stock returns have been deeply negative.
When we look at the indicator’s history, we can see that global stock price momentum—as represented by the indicator—has tended to track the performance of global stocks well.
In 2017, as just one example, the indicator stayed in the upper bullish zone for most of the year, and global stocks had a great year, with double-digit returns and low volatility. By 2018, however, momentum had fallen off a cliff. The indicator turned negative during the year, and sure enough, the MSCI ACWI had a negative return for the year.
Looking at the past couple of years, we see that the indicator stayed in an upper neutral zone for all of 2021. This resulted in good returns for global stocks. However, the indicator never really managed to get into the upper bullish zone. Globally, momentum just wasn’t strong enough. And then 2022 came around, and momentum plummeted, resulting in poor stock global stock returns so far this year.
Some potentially good news is that the indicator just briefly popped into the lower-neutral zone after last week’s update. This could be a sign that global stock momentum has turned a corner.
But, as the bear markets of the early 2000s and 2008 show, sometimes global momentum picks up briefly and turns neutral for a moment, but then it ultimately resumes its downward trend.
The indicator would need to rise all the way to the upper bullish zone before history would say it’s likely that the downward trend has been broken and a new bullish mega-trend is underway.
This is intended for informational purposes only and should not be used as the primary basis for an investment decision. Consult an advisor for your personal situation.
Indices mentioned are unmanaged, do not incur fees, and cannot be invested into directly.
Past performance does not guarantee future results.