
Every day the stock market is a tug of war. Buyers pull one way, sellers pull the other, and the price tells you who won that day. But price alone doesn’t necessarily tell you how hard each side is pulling. For that, you need to look at volume.
That is what this week’s indicator does. And it just told us something pretty interesting.
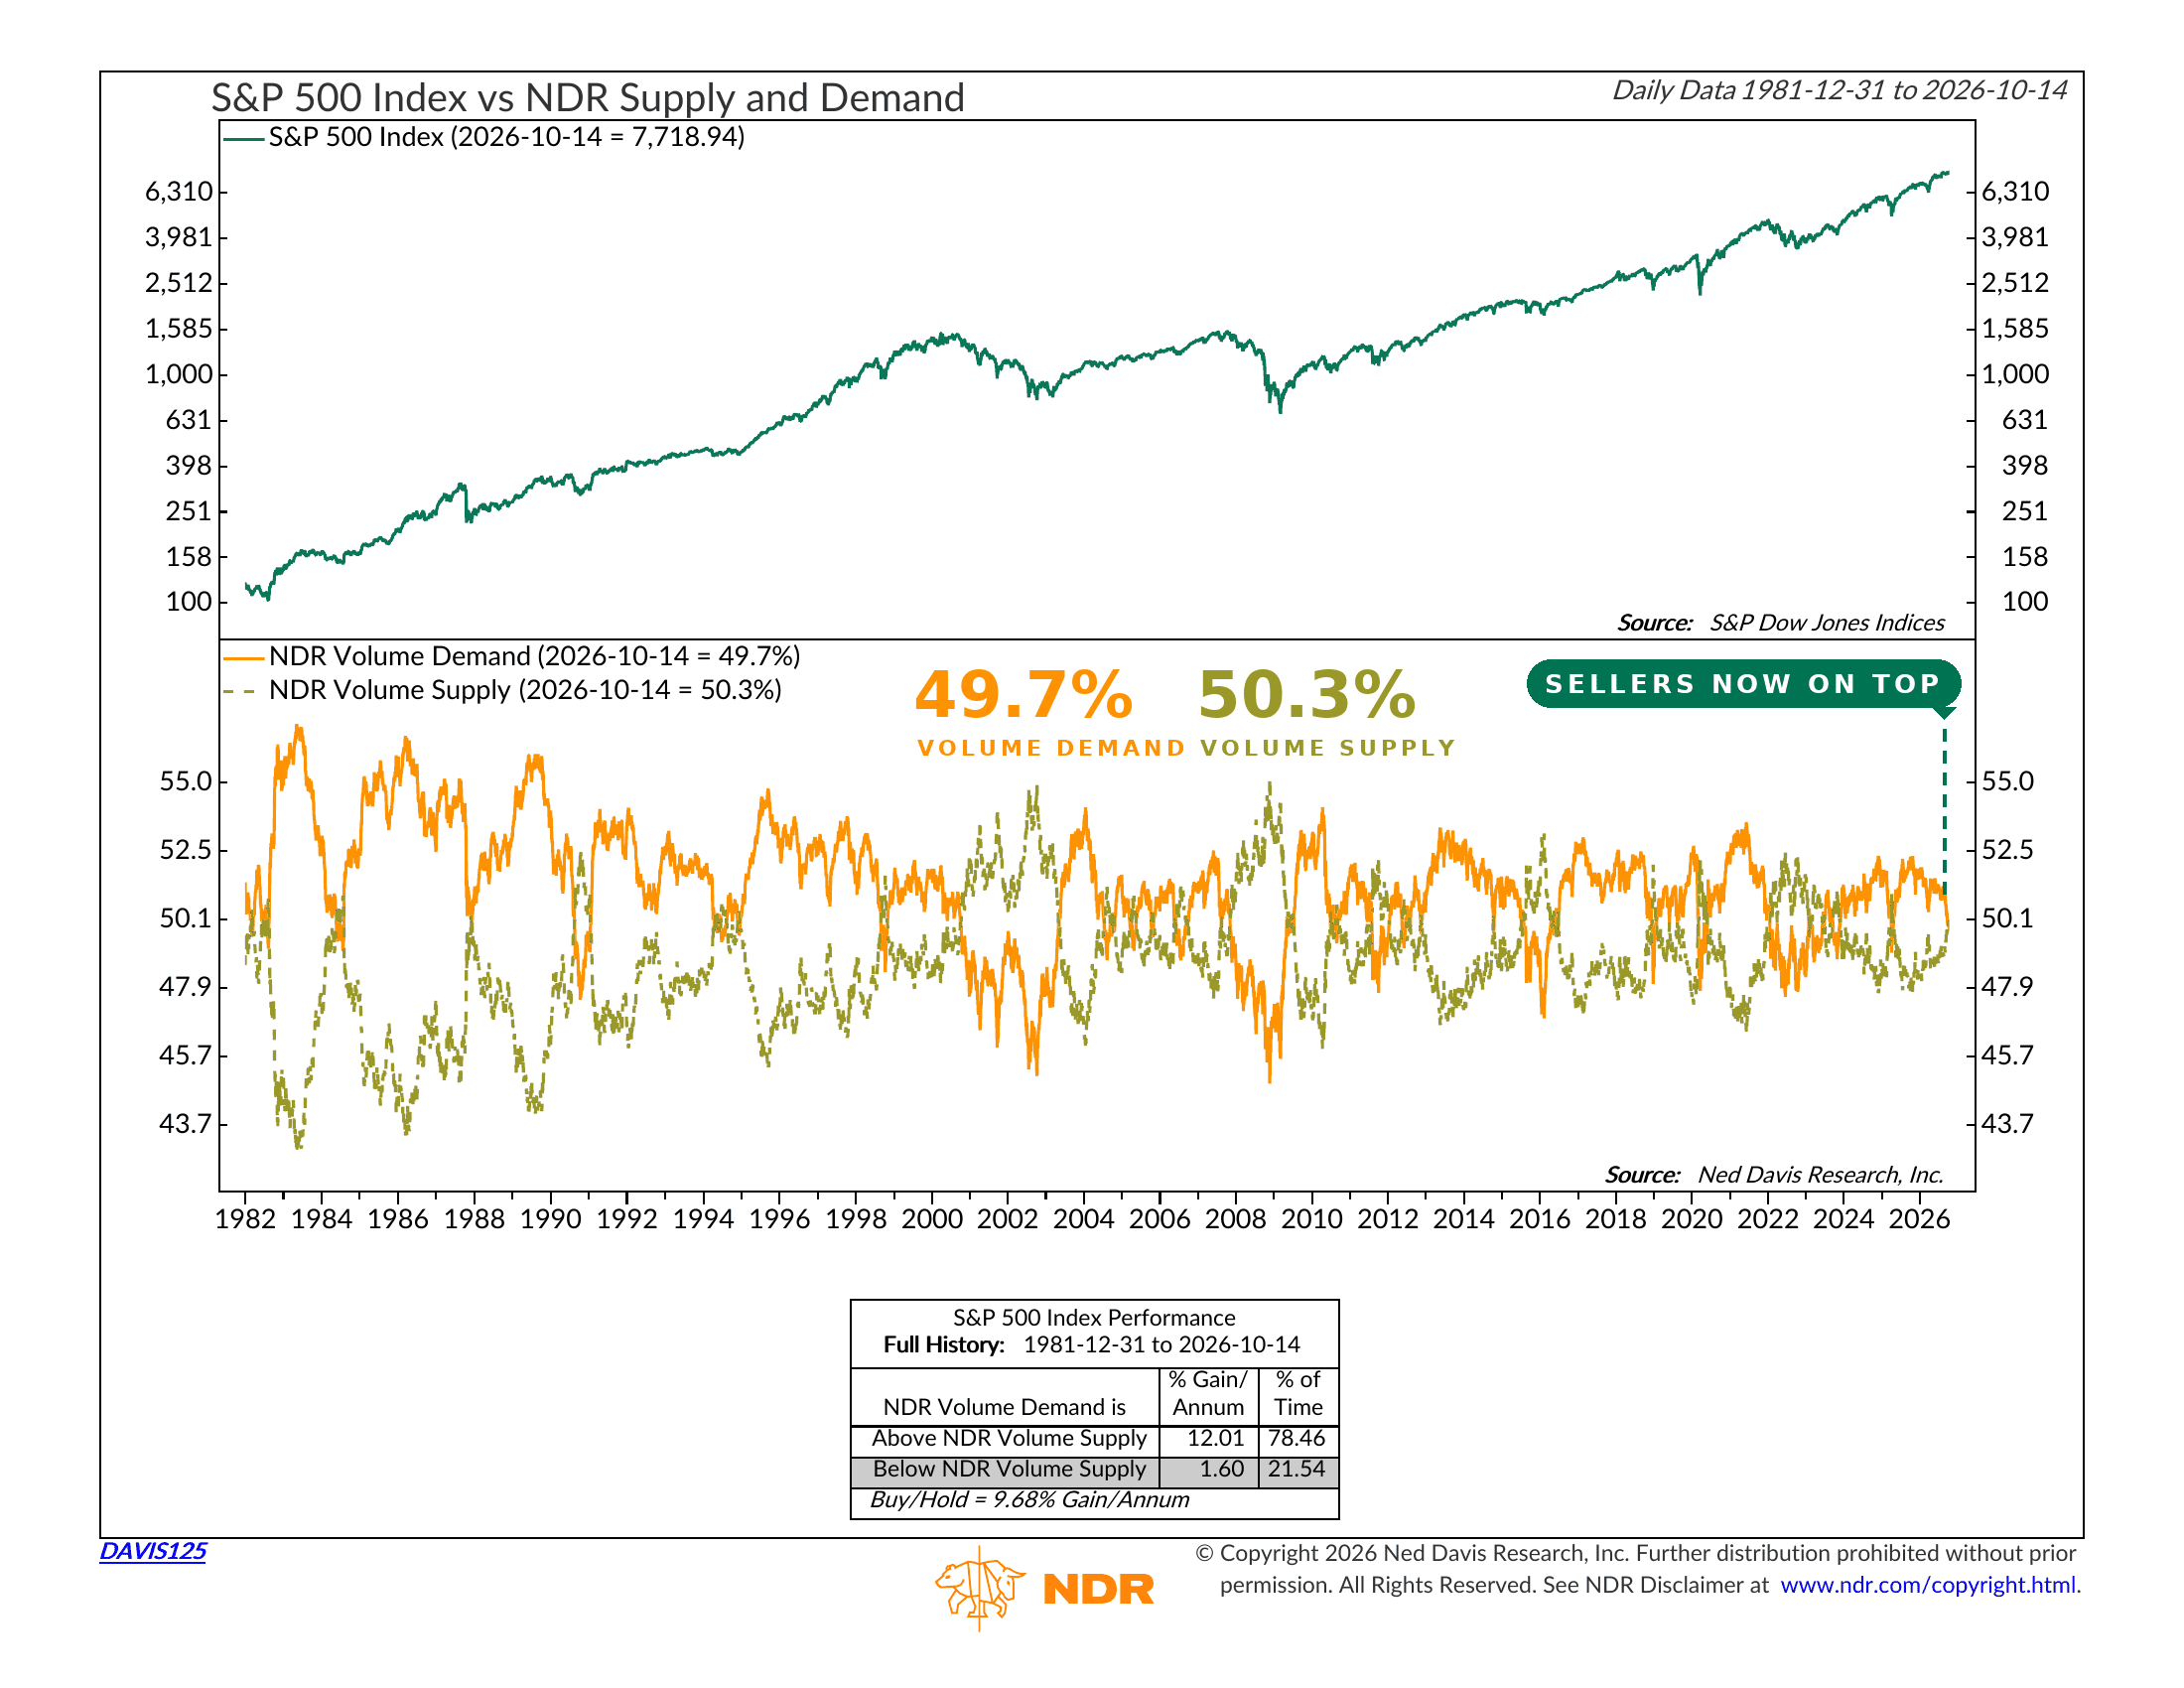
Here’s how it works. Volume Demand measures the share of trading volume that goes into stocks that are rising. Volume Supply measures the share that goes into stocks that are falling. Both are smoothed out so you see the trend and not the daily noise. Together they add up to 100%, so the question is simple: which side has more of the market’s activity behind it?
The chart above has two panels. The top shows the S&P 500 going back to 1982. The bottom shows the two volume lines. The solid orange line is Volume Demand. The dashed line is Volume Supply. When orange is on top, the buyers are winning. When the dashed line is on top, the sellers are.
The history here is hard to argue with. Since 1981, the S&P 500 has gained about 12% per year while Volume Demand was above Volume Supply. That has been the case about 78% of the time. When Volume Supply was on top, the index gained just 1.6% per year. Nearly all of the market’s gains have come while the buyers had the upper hand.
Why does that make sense? Because volume is a measure of conviction. A rally on heavy volume means a lot of money agrees with it. A rally on light volume means fewer investors are willing to chase it. So when more of the market’s activity starts showing up on down days than on up days, selling pressure is building, even if the index hasn’t fallen much yet.
Which brings us to today. Back in April, we looked at this same indicator. The sellers made a run at taking control, and they failed. Volume Demand held above Volume Supply, and stocks went on to new highs.
This time is different. The two lines have been converging slowly all year. As of October 14, Volume Demand sits at 49.7% and Volume Supply at 50.3%. The margin is slim, but the dashed line is now on top.
Meanwhile, the S&P 500 closed at 7,719 that same day, still within a few percent of its all-time high. So the price trend has not broken. But the evidence underneath it keeps getting weaker, and this indicator had been one of the holdouts. Now it has flipped too.
Of course, a crossover by itself doesn’t guarantee anything. These lines have crossed and then crossed right back before. The chart has plenty of those head fakes. So this is a shift in the balance of evidence, and it can still reverse.
The bottom line? In April, the buyers held the line and the market rewarded them. Today, the sellers hold a slight edge. Add that to the other warnings we have covered recently, and the market has some proving to do. A move back above 50% by Volume Demand would be a welcome sign that the buyers are back. Until then, the burden of proof is on the bulls.
This is intended for informational purposes only and should not be used as the primary basis for an investment decision. Consult an advisor for your personal situation.
Indices mentioned are unmanaged, do not incur fees, and cannot be invested into directly.
Past performance does not guarantee future results.
The S&P 500 Index, or Standard & Poor’s 500 Index, is a market-capitalization-weighted index of 500 leading publicly traded companies in the U.S.