
Well, there’s no doubt about it. Oil has been a—if not the—story of the year. So this week, I want to look at what a big move in oil prices has historically meant for stocks.
Now, most people feel oil prices at the gas pump. But investors feel them somewhere else. Higher oil pushes up costs for nearly every business, adds to inflation, and puts pressure on central banks to keep interest rates high. All of that tends to be a headwind for stocks.
The question, then, is how much does oil have to move before it matters?
This week’s indicator gives us a simple answer.
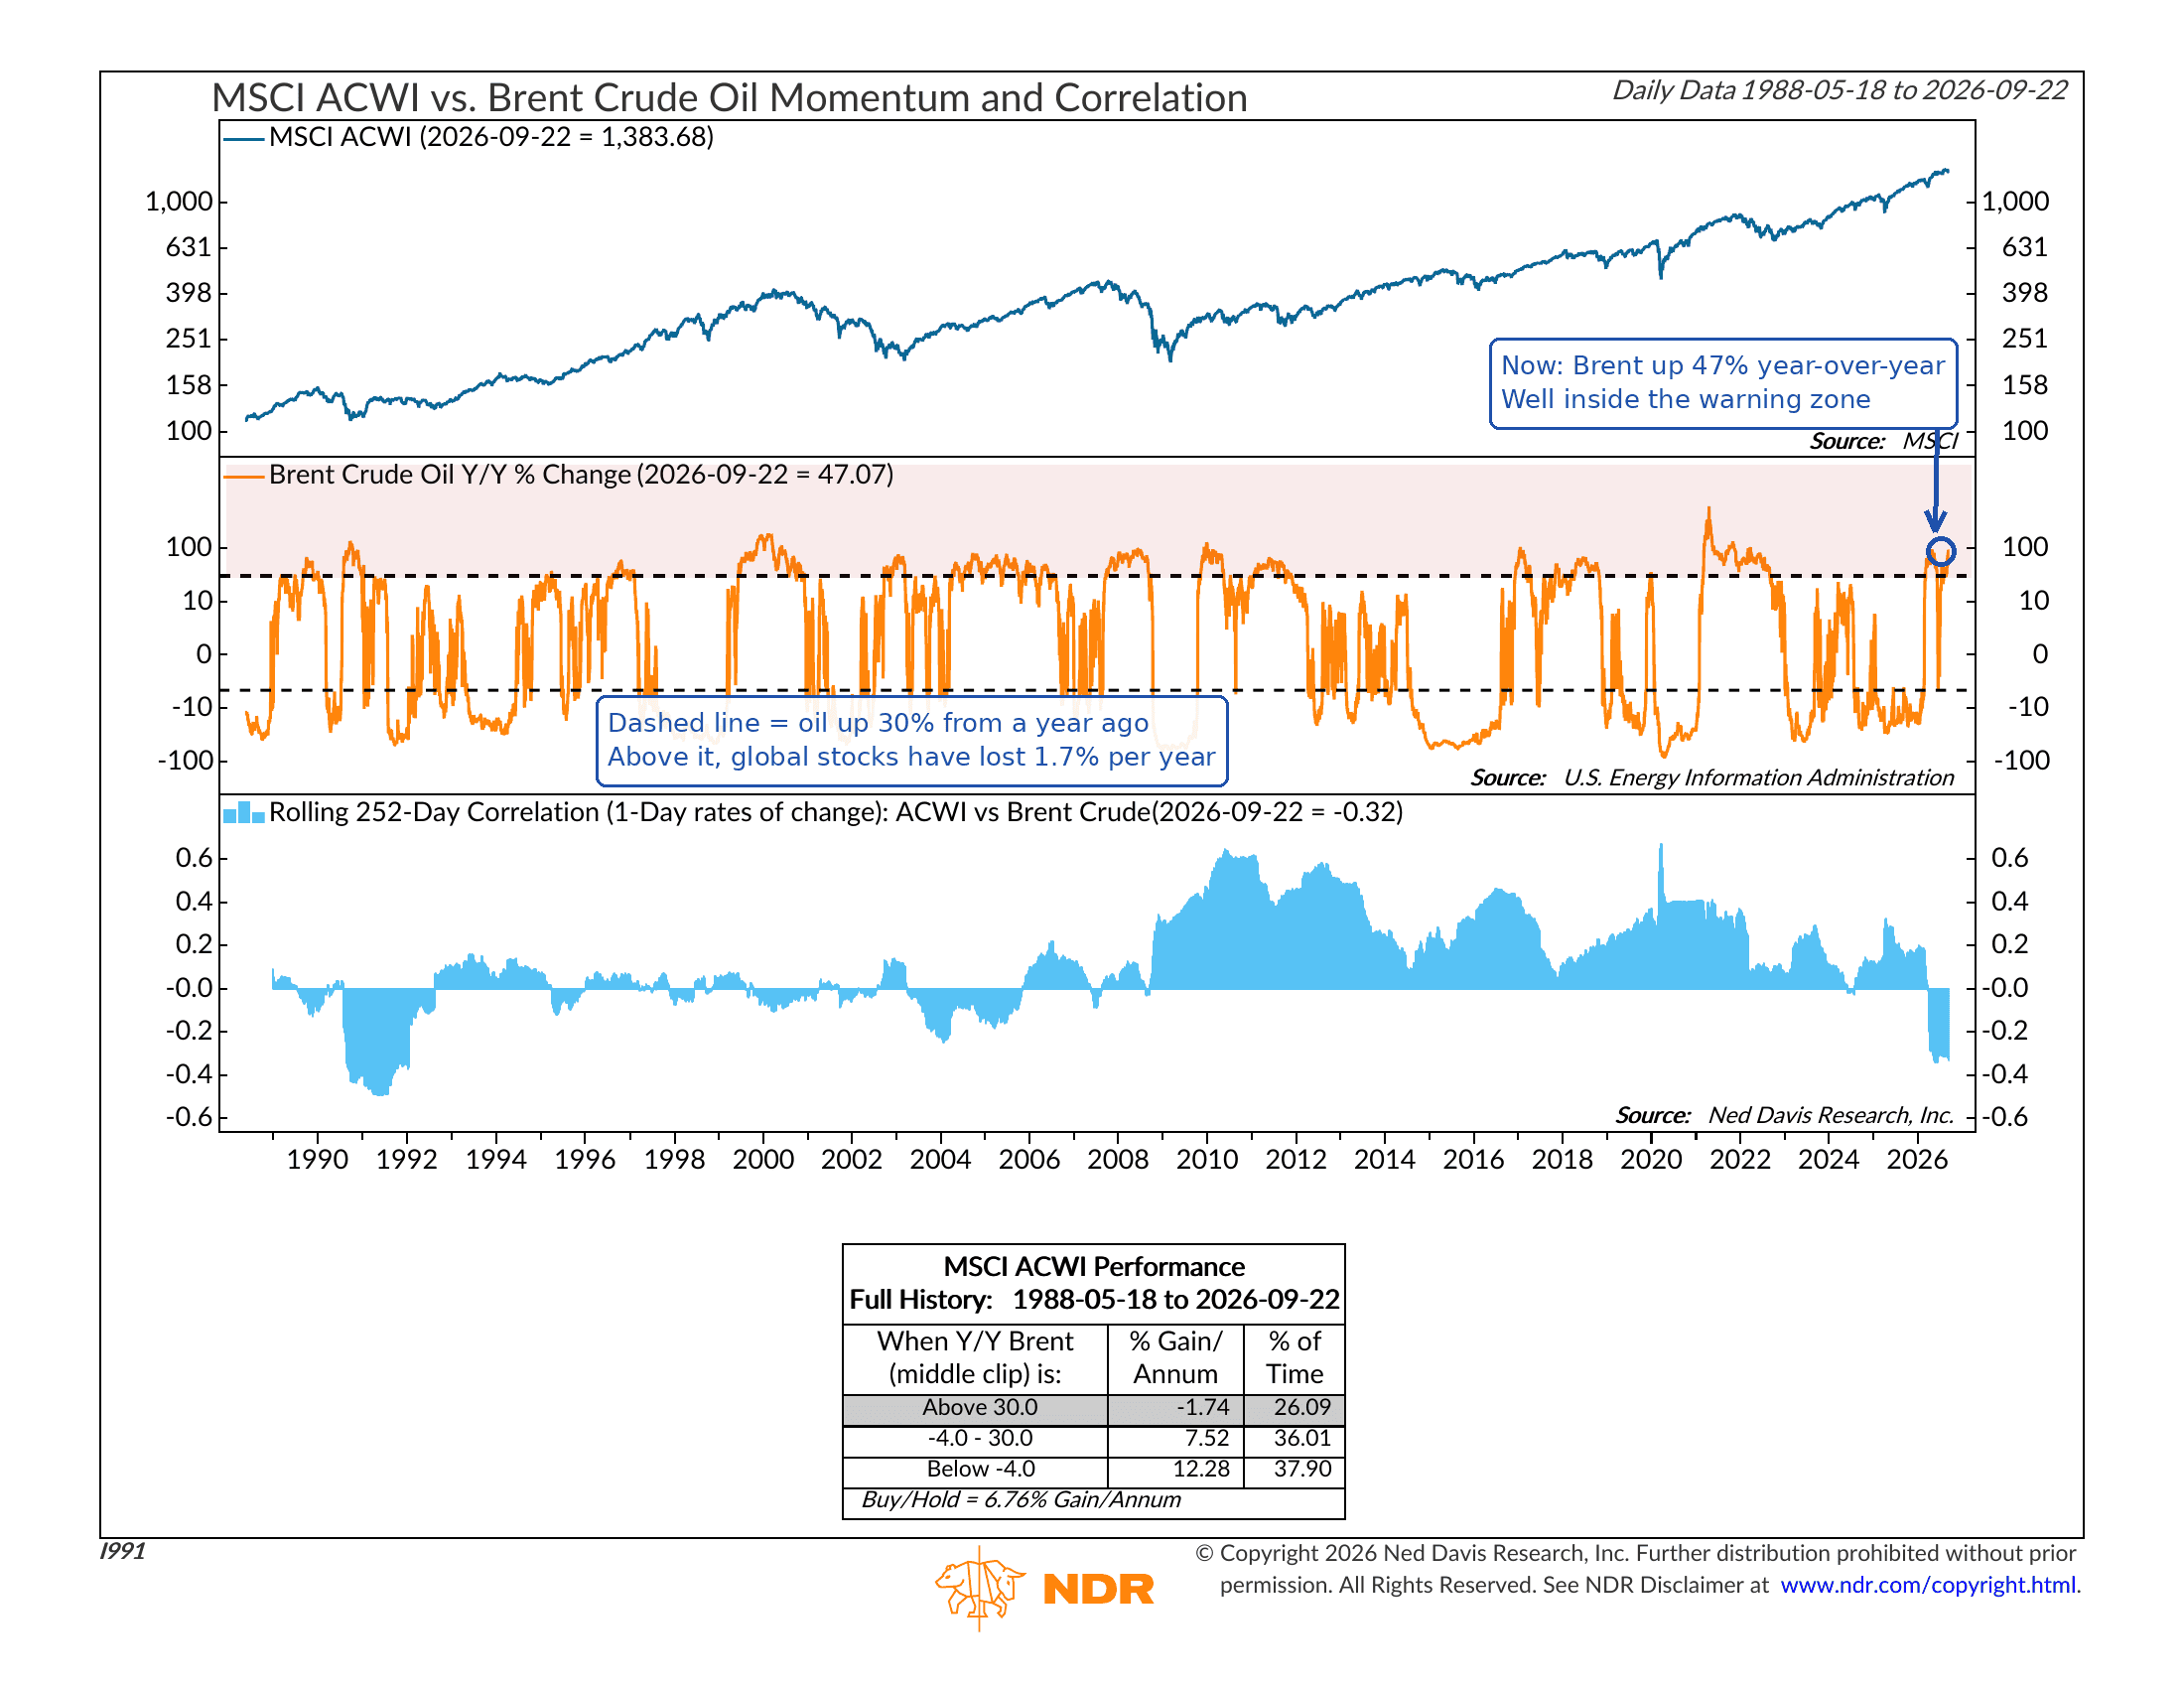
Here’s how it works. The top section of the chart above shows the MSCI All Country World Index, a broad measure of global stocks. The middle section shows the year-over-year change in the price of Brent crude oil, the global benchmark. The bottom section shows the rolling one-year correlation between the two. When that bar is below zero, oil and stocks are moving in opposite directions.
The middle section is the one to focus on. The dashed lines mark two thresholds: 30% and -4%. When oil is up more than 30% from a year ago, it has historically been a problem for stocks. When oil is down more than 4%, it has been a tailwind.
And, as you can see, the numbers back that up. Going back to 1988, when Brent was up more than 30% year-over-year, global stocks lost 1.7% annualized. That has been the case about a quarter of the time. In the middle zone, stocks gained 7.5% annualized. And when oil was down more than 4%, stocks gained 12.3% annualized, nearly double the long-term average of 6.8%.
That’s a pretty wide spread. Cheap oil has obviously been very good for stocks. Expensive oil? Not so much.
So where are we now? Well, as of Tuesday, Brent crude was up 47% from a year ago. That is well above the 30% threshold and squarely in the zone that has been the worst for stocks.
The correlation in the bottom section is important to note as well. At -0.32, it is the most negative reading since the early 1990s. In plain English, that basically means that when oil has gone up lately, stocks go down.
Now, this indicator is not really a timing tool. Oil momentum can stay above 30% for a while, and stocks don’t always fall when it does. Global stocks have held up reasonably well this year despite the energy shock. And year-over-year comparisons can shift quickly. If oil simply stops rising, the reading will fall back toward the neutral zone on its own as last year’s prices roll off.
But it does help explain why the market has been so sensitive to oil headlines this year. The last time oil momentum ran this hot was 2022. That was not a good year for stocks. That doesn’t mean history will repeat, but I do think it at least deserves some attention.
The bottom line? For the bull market to keep going, oil probably needs to cool off. Until it does, this indicator will likely stay in its warning zone, and energy prices will likely remain one of the biggest swing factors for stocks heading into the fourth and final quarter of the year.
This is intended for informational purposes only and should not be used as the primary basis for an investment decision. Consult an advisor for your personal situation.
Indices mentioned are unmanaged, do not incur fees, and cannot be invested into directly.
Past performance does not guarantee future results.
The MSCI All Country World Index (ACWI) is a market-capitalization-weighted index designed to measure the performance of large- and mid-cap stocks across developed and emerging markets worldwide.