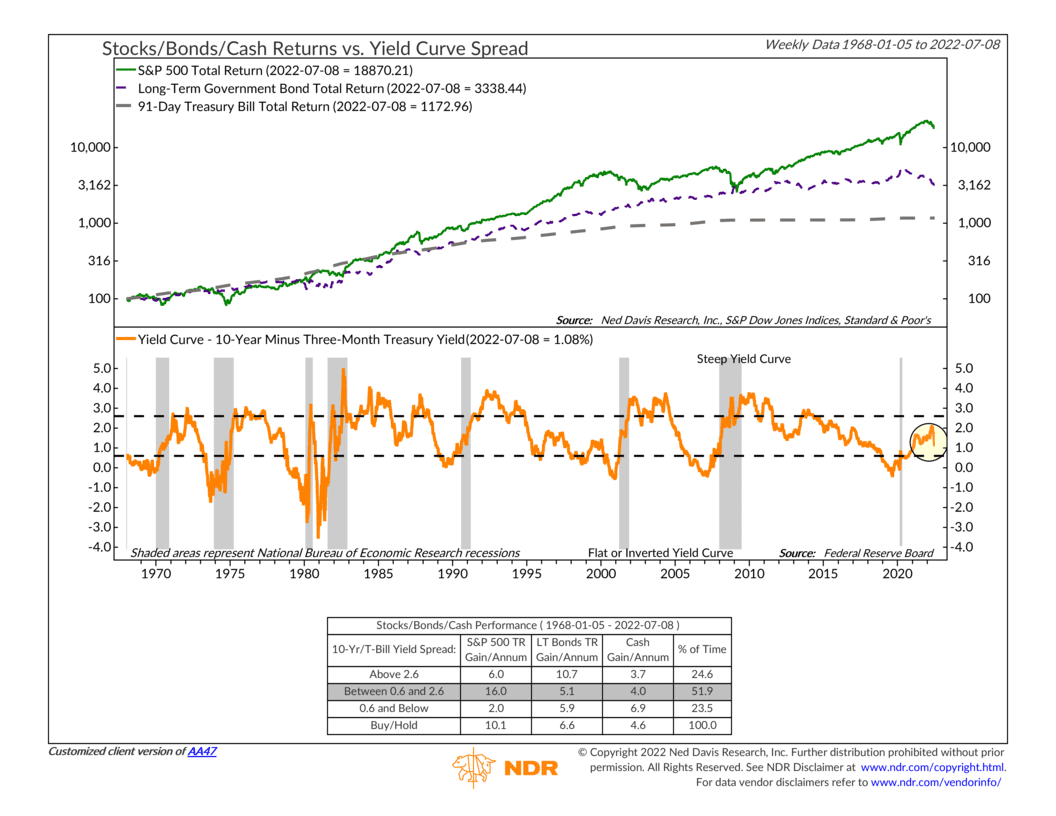
For this week’s indicator, we have a metric that measures the Treasury yield curve. This specific yield curve looks at the difference between the yield on a 10-year Treasury bond versus a 3-month Treasury bond. This is depicted as the orange line on the bottom clip of the chart above.
In normal times, this curve slopes upwards. In other words, long-term yields are higher than short-term yields. Historically, a moderately upward sloping yield curve (between the brackets) has been the best zone for stock returns. A steep yield curve (above the upper bracket) has been best for bond returns.
However, sometimes the curve flattens out, and both yields are closer together. And in a few rare instances, the curve actually inverts (the orange line drops below the lower bracket), meaning short-term yields climb above long-term yields. In this case, both stocks and bonds tend to underperform relative to cash, as the performance box at the bottom of the chart shows.
Historically, an inverted yield has been a warning sign that an economic recession is right around the corner. Why? Because investors are forward-looking, and when they think the economy’s long-term outlook is poor, they buy long-term Treasuries on the premise that they will help preserve capital and potentially appreciate in value as interest rates decline and stocks sell off. This leads to lower long-term yields relative to short-term yields (i.e., an inverted yield curve.)
Monetary policy matters a lot, too. The Fed effectively controls the short end of the yield curve. But investors have more control over the longer end of the curve. So, when inflation is running hot—like it is now—the Fed will start raising short-term rates in order to cool off the economy. But if investors think these higher rates will choke off economic growth too much, they push long-term yields lower. This weird dynamic tends to occur months in advance of an economic recession.
So that’s the worry today. Looking at the chart, we can see that the yield curve has started flattening in recent months. Currently, the 10-year Treasury only yields about 1.08 percentage points more than the 3-month Treasury. According to this indicator, if the spread drops below 0.6 percentage points, it will be in a zone that has historically led to weak stock and bond returns relative to cash.
This week, the Consumer Price Index—a measure of inflation in the economy—came in at a 9.1% rate in June on a year-over-year basis. Because of this, the market now thinks there is a very good chance that the Fed will hike rates anywhere from 0.75 to 1.00 percentage points in a couple of weeks. If this does indeed happen, we expect our yield curve indicator to fall into the negative zone.
This is on our radar, and we’ll be watching our other yield curve indicators as more deterioration on that front could ultimately impact the yield curve component of our overall stock market risk model.
This is intended for informational purposes only and should not be used as the primary basis for an investment decision. Consult an advisor for your personal situation.
Indices mentioned are unmanaged, do not incur fees, and cannot be invested into directly.
Past performance does not guarantee future results.