
It’s football season. If you watched any games, there’s a good chance you’ve seen it before. The other team is driving, the crowd gets loud, and the camera pans to two fans in the stadium standing up holding a big letter “D” and a section of a picket fence.
D-fence. Yep, we all know the drill: that means it’s time to play some defense and hold the line. Well, it’s kind of funny, but the stock market has its own version of that sign.
With the Fed, the midterms, and big tech earnings all hitting this week, it’s been easy to miss. But under the hood, money has been drifting out of the parts of the market that need a strong economy and into the parts that don’t. Think toothpaste, prescriptions, and electric bills, you know, the things people buy no matter what.
So, for this week, let’s look at an indicator that tracks that shift.
Here’s how it works. Split the market into two equal-weighted baskets. The first holds the cyclical sectors—energy, materials, industrials, financials, technology, communication services, and consumer discretionary. These do best when the economy is humming. The second holds the defensive sectors—consumer staples, health care, utilities, and telecom. These hold up better when it slows.
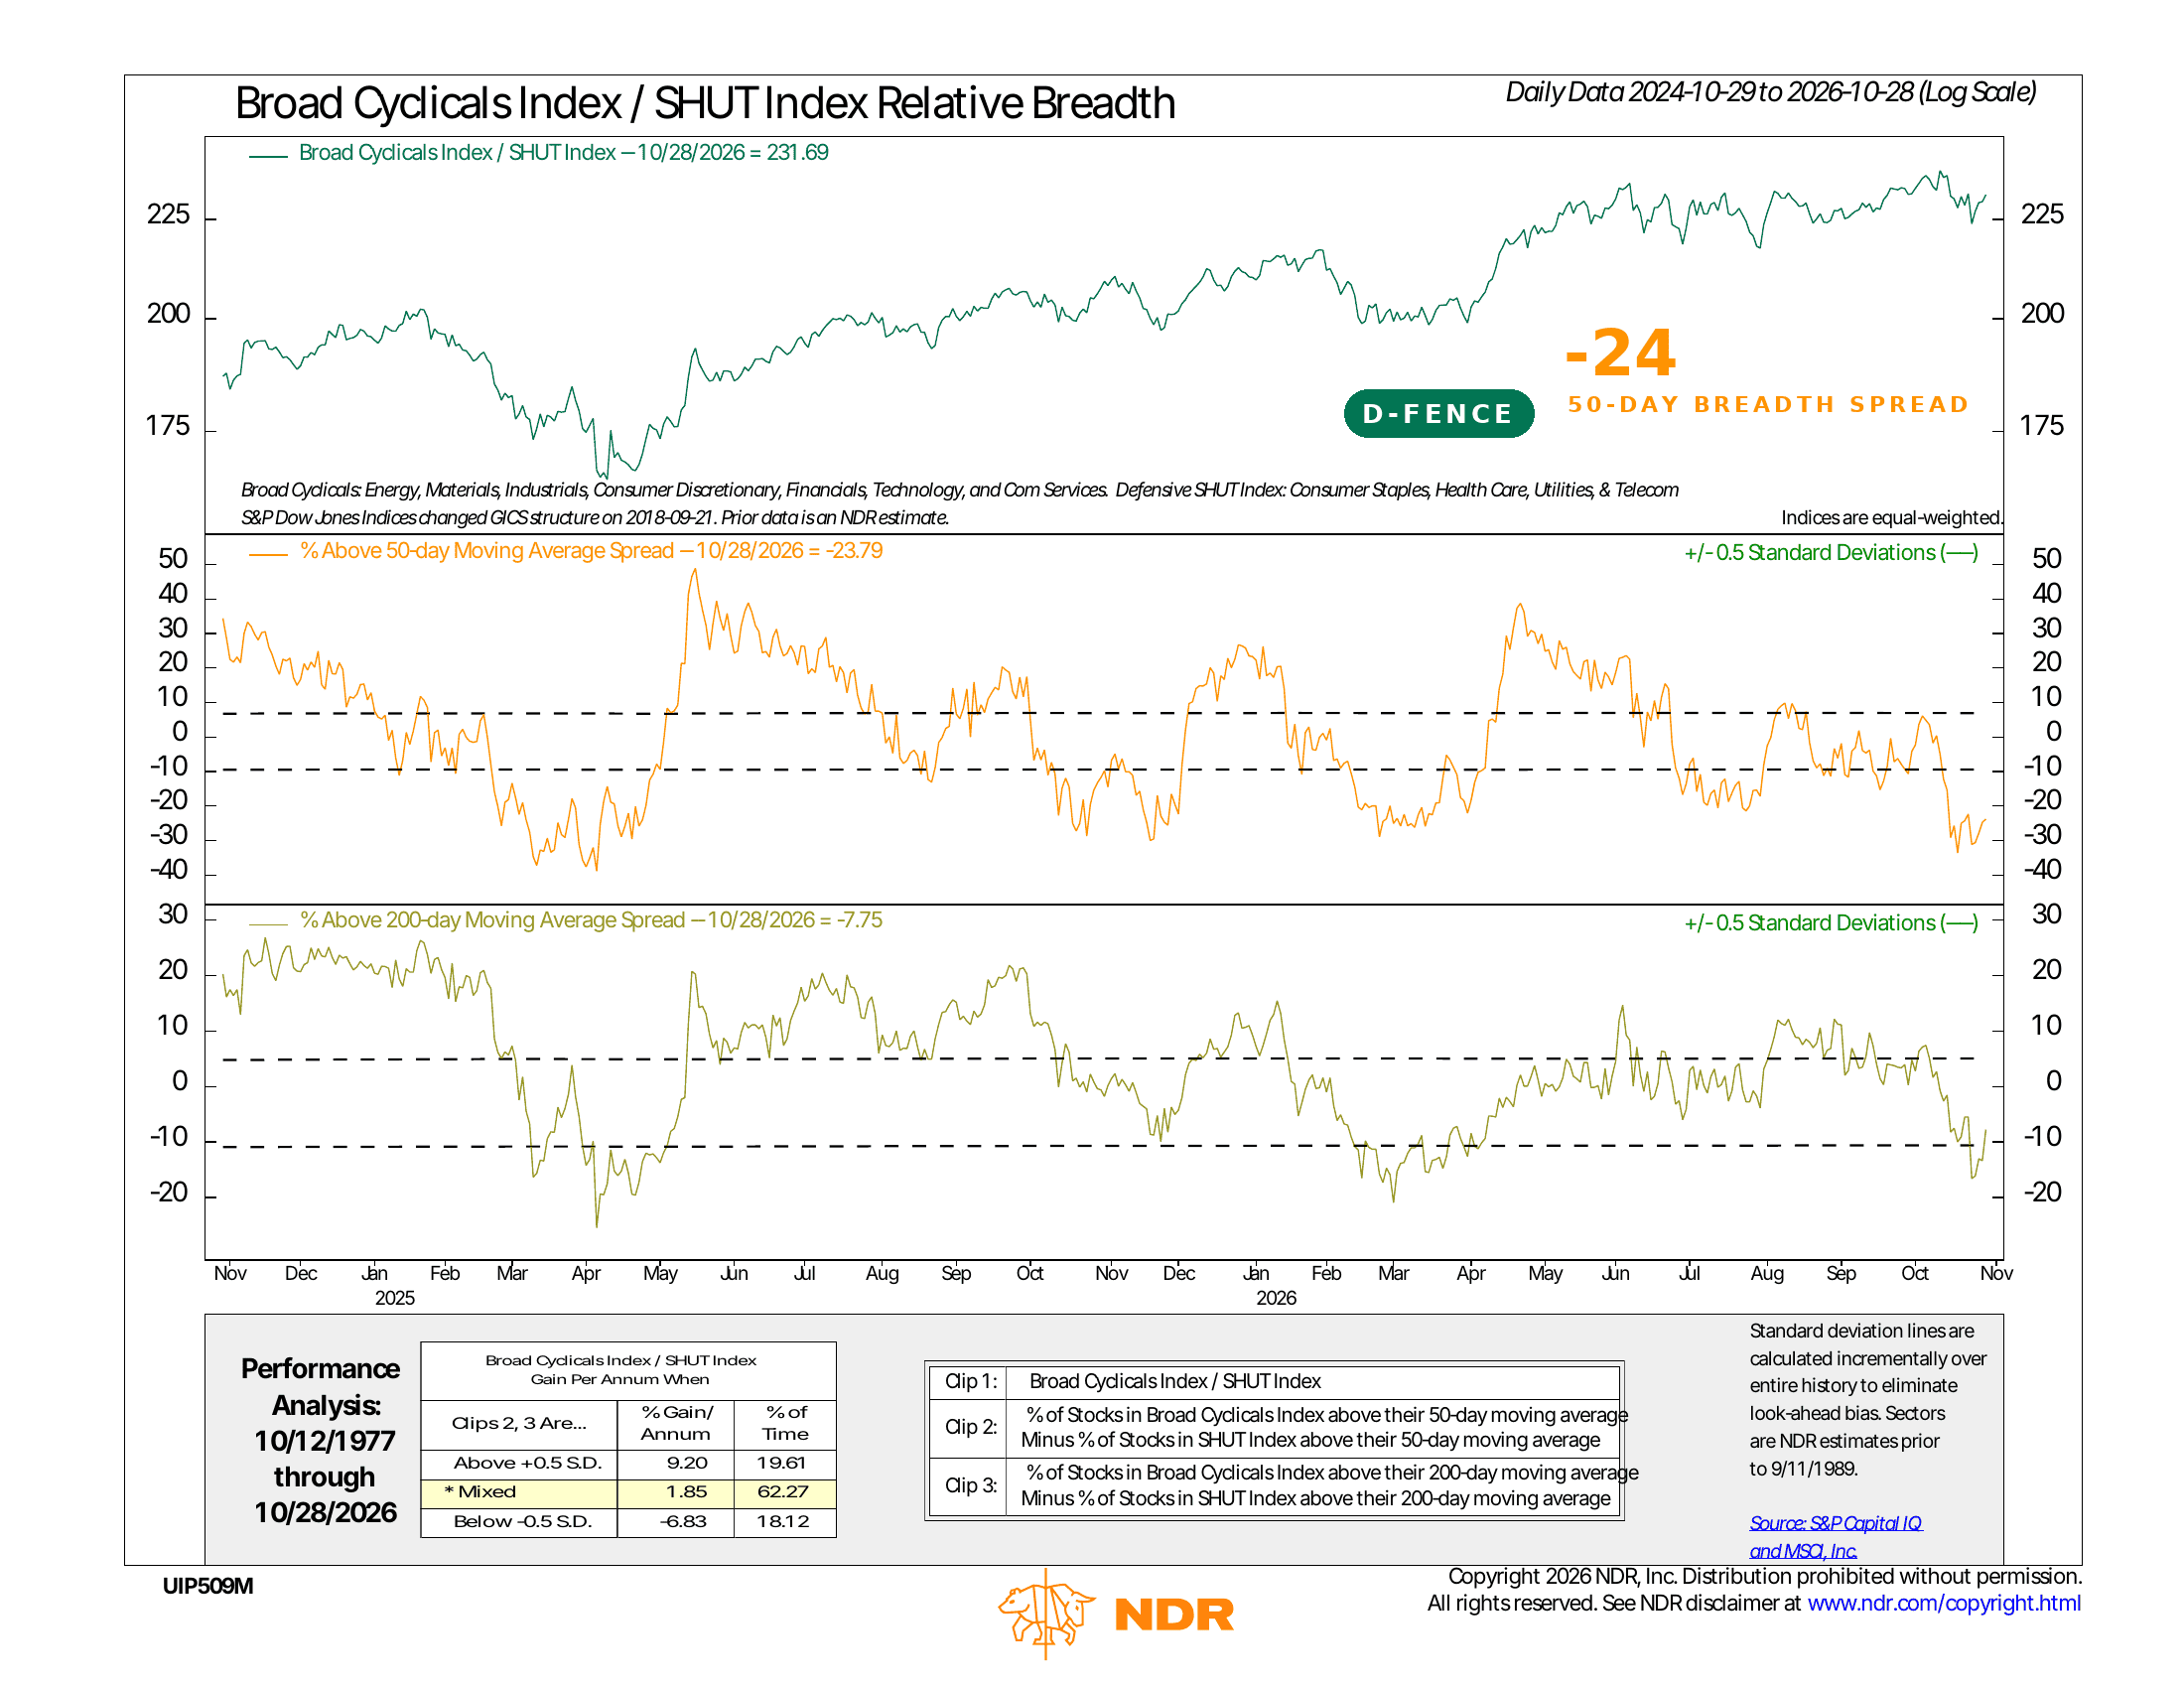
The top panel of the chart simply divides the cyclical basket by the defensive one. When the line rises, the market is playing offense. When it falls, it’s playing defense.
Now, the two lower panels are where the analysis happens. They measure breadth—how many stocks in each basket are in an uptrend. The middle panel takes the percentage of cyclical stocks above their 50-day average and subtracts the same figure for defensive stocks. The bottom panel does the same with the 200-day average. Above the upper dashed bands, the cyclicals are firmly in charge. Below the lower bands, the defensives have taken over.
History bears this out. Going back to 1977, when both breadth lines have been above their upper bands, cyclicals have beaten defensives by about 9% per year. When both have been below their lower bands, cyclicals have lost nearly 7% per year to the defensives. Everything in between has been close to a wash.
So where are we now? As of October 28, the 50-day breadth spread sits at -24. That means far more defensive stocks are in short-term uptrends than cyclical ones. Back in May, that number was well above +30. The 200-day spread has dropped to -8 and is sitting right on its lower band. One more leg down and both lines would be in the weakest zone.
Meanwhile, the scoreboard (cyclicals versus defensives ratio) in the top clip still favors the cyclicals. That ratio had a decent run from the April 2025 lows and still remains near its highs, despite the October dip.
But, with all that said, I will give a word of caution. A defensive rotation heading into a midterm election is pretty common, and many cyclical stocks are oversold. A rebound in the coming weeks would not be a surprise.
Still, though, leadership matters. When staples and utilities are leading instead of banks, industrials, and tech, investors are telling you they expect slower growth ahead. That lines up with last week’s shift toward higher-quality stocks.
The bottom line? Over the past month, the market has moved from offense to defense. That alone doesn’t mean a downturn is coming—plenty of games have been won on a good defensive stand. But when the crowd starts holding up the fence, it usually means they see something coming. It fits with the more cautious tone we’ve been describing in this space, and it is definitely a shift worth watching closely.
This is intended for informational purposes only and should not be used as the primary basis for an investment decision. Consult an advisor for your personal situation.
Indices mentioned are unmanaged, do not incur fees, and cannot be invested into directly.
Past performance does not guarantee future results.
The Broad Cyclicals Index is an equal-weighted index of U.S. stocks in the Energy, Materials, Industrials, Consumer Discretionary, Financials, Technology, and Communication Services sectors.
The SHUT Index is an equal-weighted index of U.S. stocks in the Consumer Staples, Health Care, Utilities, and Telecommunications sectors.