One of the big surprises in markets this year has been the strength of international stocks compared to the U.S. For years, American markets have been the clear leader. But then 2025 rolled around and things changed a bit. Tariffs were announced, the dollar weakened, and suddenly global markets started to shine while the U.S. slipped behind.
This week’s indicator helps explain why that happened—and why things may now be changing.
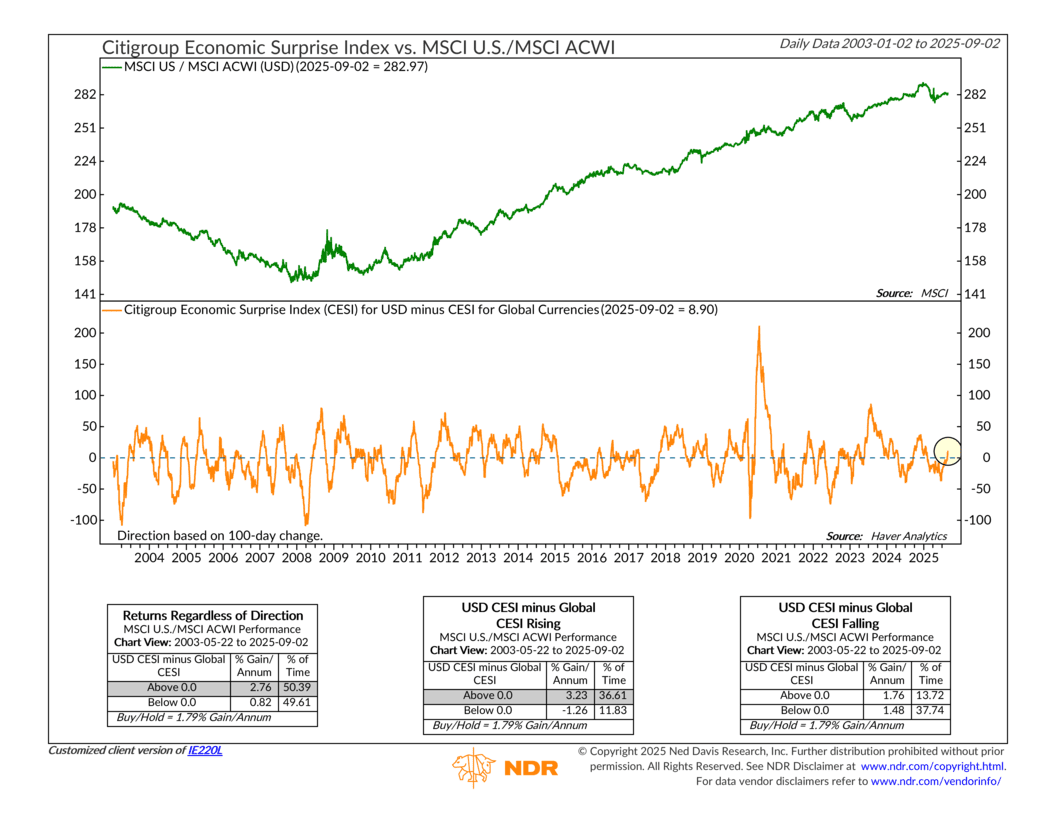
At the top of the chart, the green line shows the ratio of U.S. stocks to the rest of the world. Think of this as a ratio explaining how America is doing versus everyone else. When the line goes up, the U.S. is leading. When it goes down, the rest of the globe is doing better.
The orange line on the bottom adds some context. It’s the Citigroup Economic Surprise Index (CESI), which tracks whether economic reports beat or miss expectations. Here, we’re looking at the difference between U.S. surprises and global surprises. If the line is above zero, the U.S. is beating expectations more often than the rest of the world. If it’s below zero, America is falling short.
History shows that when the U.S. CESI runs hotter than the global one, U.S. stocks tend to pull ahead. When the opposite is true, America falls behind. You can see that relationship in the tables at the bottom of the chart. Since the start of this indicator (2003), positive readings have lined up with stronger performance for U.S. markets.
So OK, where are we now? Well, after months of sitting below zero, the orange line has finally poked back into positive territory. That means U.S. data is starting to beat expectations again. In other words, it appears that the current run of U.S. underperformance could be coming to an end. The incoming data is now looking more favorable in the U.S., and that could lead to better relative returns going forward.
Is this a guarantee? Certainly not. But it does add some weight to the idea that at the end of the day, the U.S. is where a lot of the economic (fundamental) growth is happening in the world economy—and that typically leads to better relative stock market returns over time.
This is intended for informational purposes only and should not be used as the primary basis for an investment decision. Consult an advisor for your personal situation.
Indices mentioned are unmanaged, do not incur fees, and cannot be invested into directly.
Past performance does not guarantee future results.